Fig. 3.
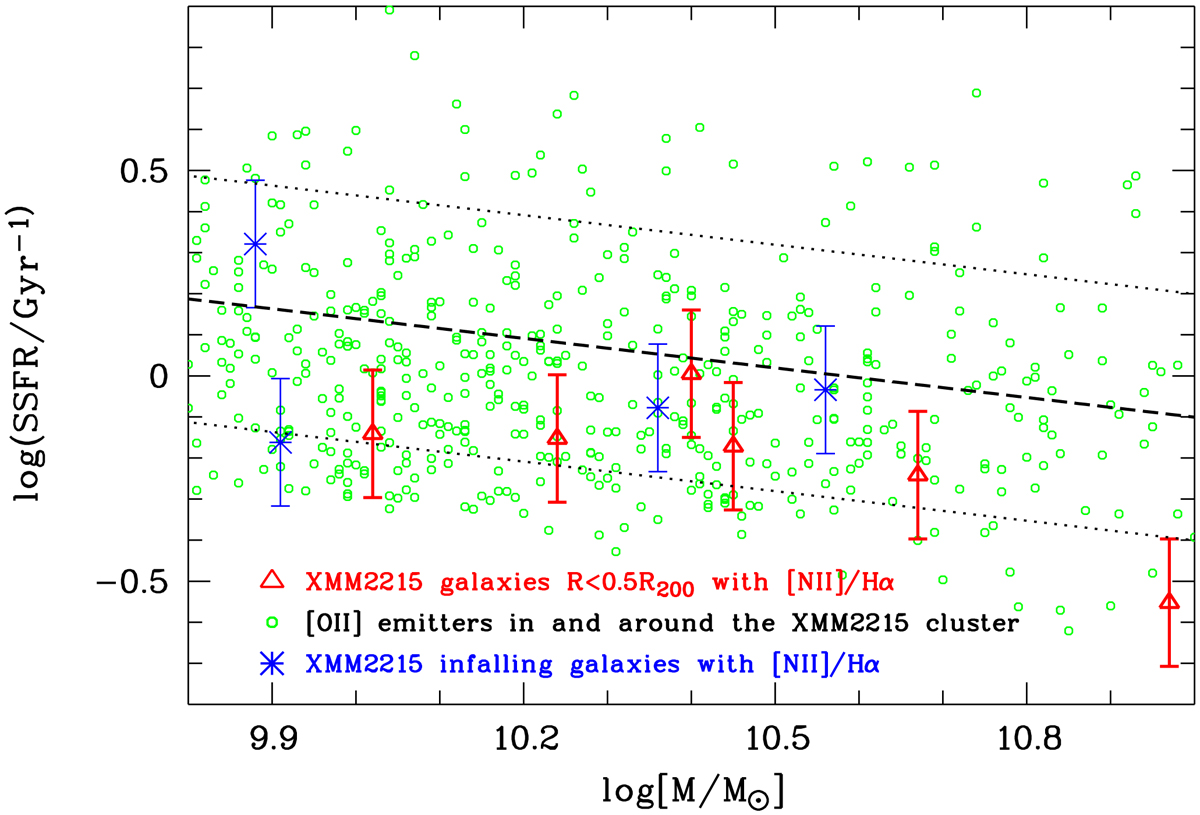
Mass–SSFR relation for the [OII] emitters in and around the XMM2215 cluster (green open circles), the six XMM2215 cluster galaxies of the SFvirialized sample (red triangles) and four infalling cluster galaxies (blue symbols). The oblique dashed line shows the MS at z ∼ 1.46 and its dispersion (indicated by the dotted lines) using Eq. (1) in Peng et al. (2010).
Current usage metrics show cumulative count of Article Views (full-text article views including HTML views, PDF and ePub downloads, according to the available data) and Abstracts Views on Vision4Press platform.
Data correspond to usage on the plateform after 2015. The current usage metrics is available 48-96 hours after online publication and is updated daily on week days.
Initial download of the metrics may take a while.