Free Access
Fig. D.6.
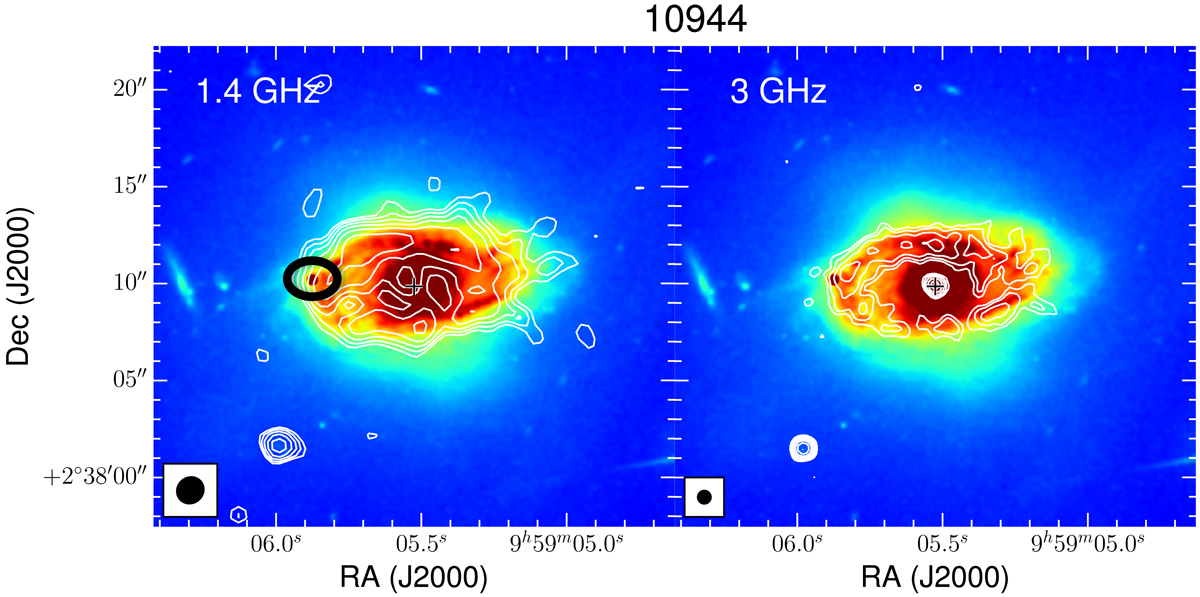
Source 10944 radio contours at 1.4 GHz (left) and 3 GHz (right) overlaid on the HST map (colour scale). The contours start at the 3σ level and rise logarithmically. The HST map is from Koekemoer et al. (2007). The black circle marks the knot discussed in the text.
Current usage metrics show cumulative count of Article Views (full-text article views including HTML views, PDF and ePub downloads, according to the available data) and Abstracts Views on Vision4Press platform.
Data correspond to usage on the plateform after 2015. The current usage metrics is available 48-96 hours after online publication and is updated daily on week days.
Initial download of the metrics may take a while.