Fig. 5.
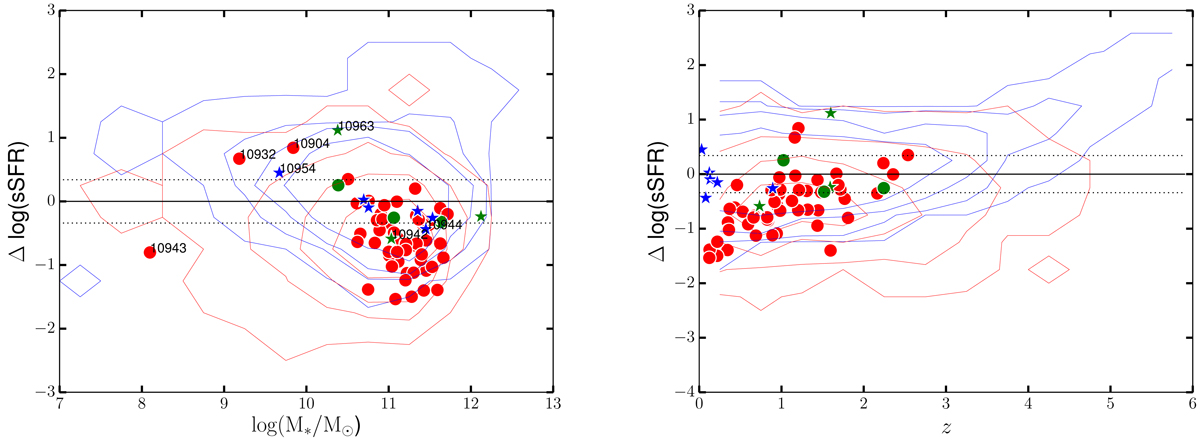
ΔsSFR, the logarithmic difference between the specific SFR and the specific SFR of objects lying on the MS and at the same redshift, versus stellar mass M* (see Delvecchio et al. 2017, for details on SFR calculation) shown on the left, and versus redshift z on the right. Symbols: red circles are the multi-component objects classified as AGN at 3 GHz VLA-COSMOS (objects that exhibit jets or lobes), as shown in Table A.1; blue stars are multi-component SFGs (see Sect. 2 for classification); green circles or stars are multi-component objects with uncertain classification (see Sect. 3.1), with circles used for AGN and stars for SFG based on the radio excess flag (see Sect. 3.1); the blue contours represent the single-component SFGs (objects that show no radio excess; Delvecchio et al. 2017) and the red contours are for single-component AGN (radio excess objects). The black solid and dashed lines show the main sequence for star-forming galaxies and its dispersion (Whitaker et al. 2012).
Current usage metrics show cumulative count of Article Views (full-text article views including HTML views, PDF and ePub downloads, according to the available data) and Abstracts Views on Vision4Press platform.
Data correspond to usage on the plateform after 2015. The current usage metrics is available 48-96 hours after online publication and is updated daily on week days.
Initial download of the metrics may take a while.