Free Access
Fig. A.1.
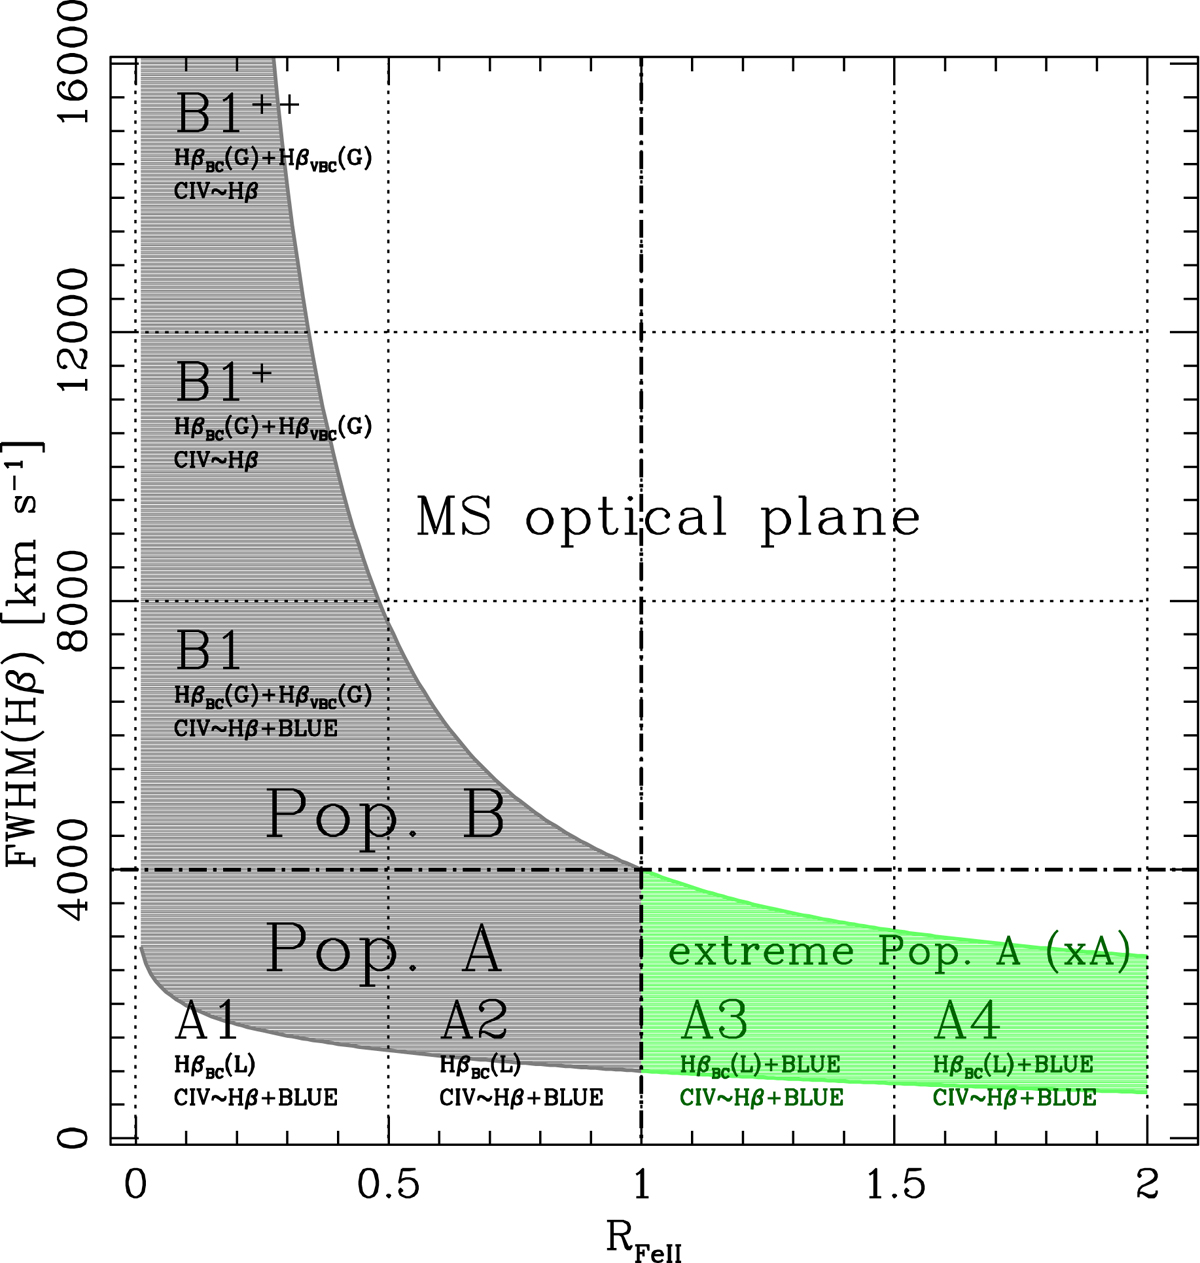
Schematic representation of the optical plane of the quasar MS, with the subdivisions identifying spectral types along the sequence. The main components that are blended in the Hβ and C IVλ1549 profile are listed in each spectral bin. The shaded area shows the approximate occupation of low-z quasars sample in the plane.
Current usage metrics show cumulative count of Article Views (full-text article views including HTML views, PDF and ePub downloads, according to the available data) and Abstracts Views on Vision4Press platform.
Data correspond to usage on the plateform after 2015. The current usage metrics is available 48-96 hours after online publication and is updated daily on week days.
Initial download of the metrics may take a while.