Fig. 2.
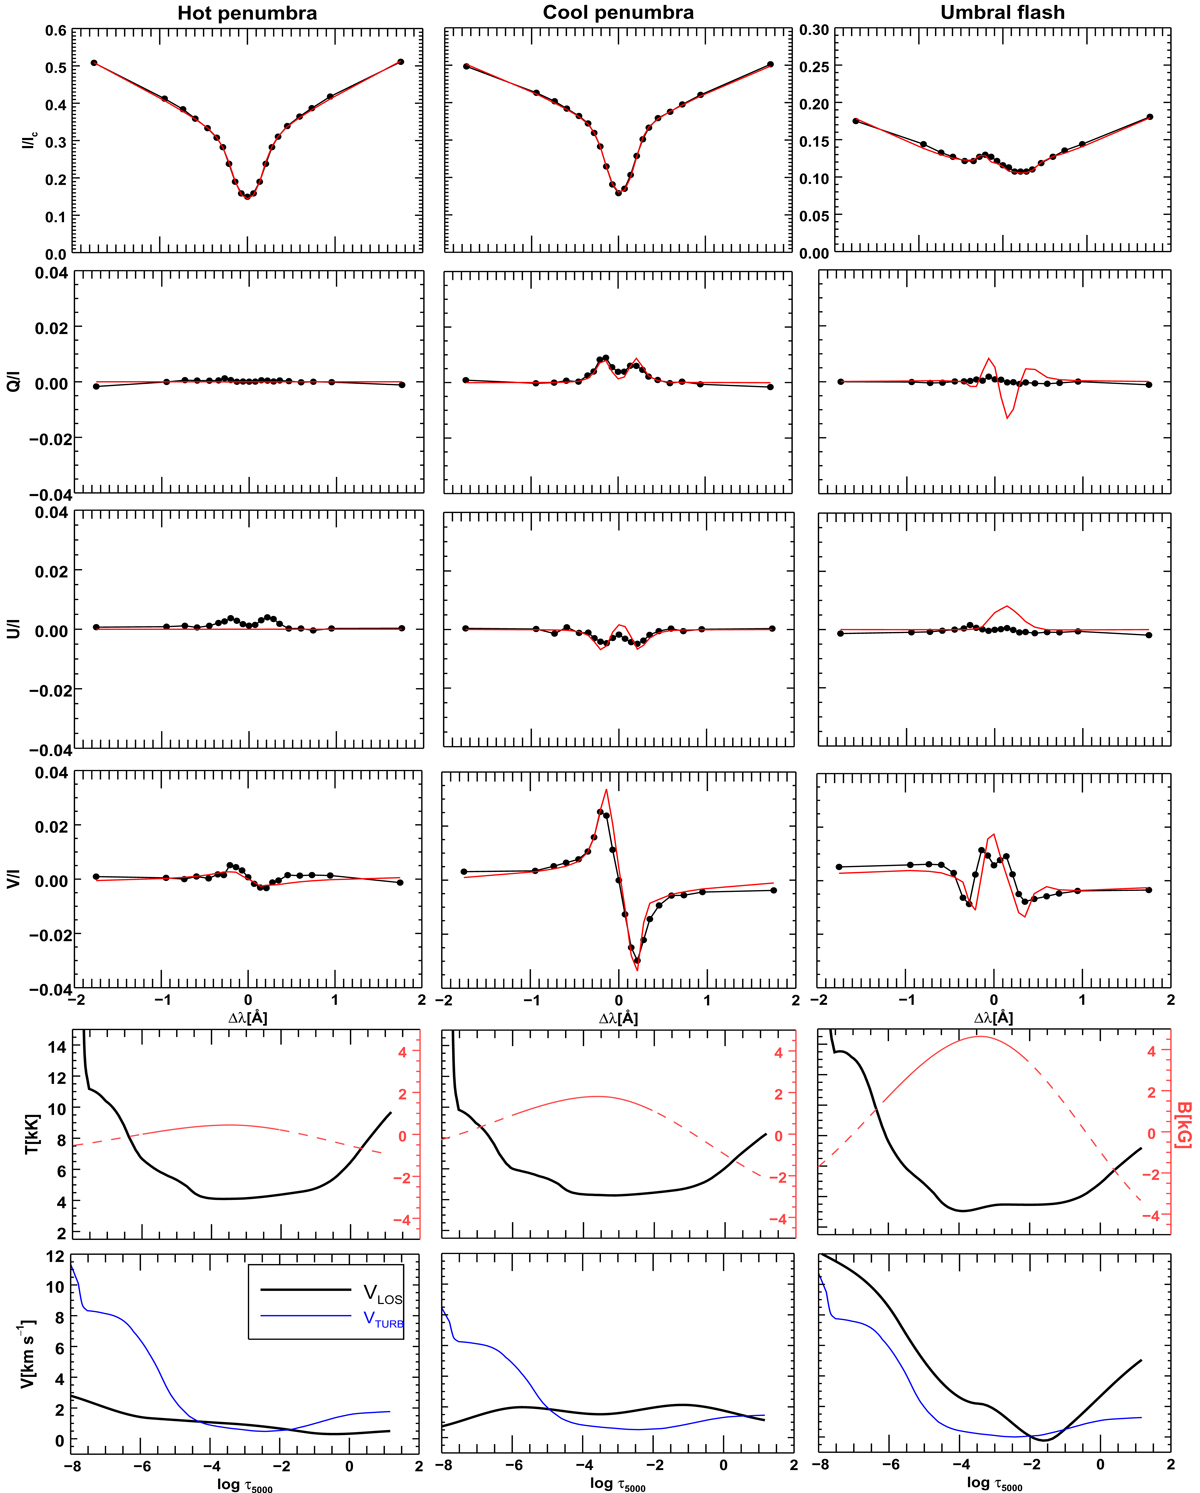
Columns showing the observed (black dots) and synthetic (red) full Stokes spectra in units of normalized HSRA (Gingerich et al. 1971) continuum intensity at disk center at a wavelength in the middle of the spectral range, and their atmospheric parameters such as temperature, LOS magnetic field, velocity, and microturbulent velocity for three different models: hot penumbra (asterisk), cool penumbra (“cross”), and umbral flash (“plus sign”), respectively. The continuous line overplotted on the dashed line for the LOS magnetic field, shows the variation of the magnetic field in the region log τ = [−6, −2] where the Ca 8542 spectra is most sensitive.
Current usage metrics show cumulative count of Article Views (full-text article views including HTML views, PDF and ePub downloads, according to the available data) and Abstracts Views on Vision4Press platform.
Data correspond to usage on the plateform after 2015. The current usage metrics is available 48-96 hours after online publication and is updated daily on week days.
Initial download of the metrics may take a while.