Fig. 3.
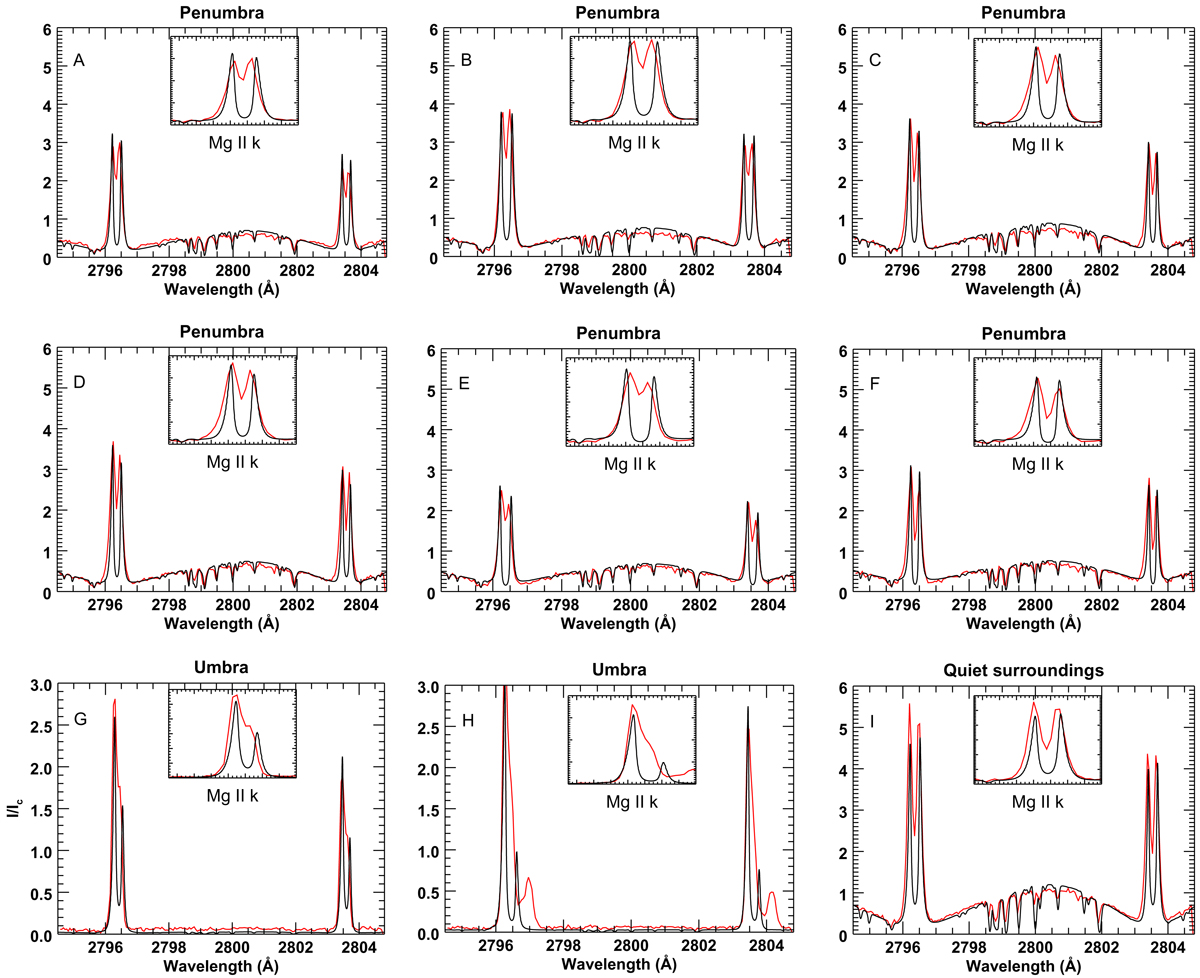
Comparison of the synthesized Mg II h&k spectra (black) with co-spatial and co-temporal IRIS observations (red) for various features in the FOV like penumbra, umbra, and quiet surroundings. Profiles A, E, G, and I correspond to the hot penumbra, cool penumbra, umbral flash, and quiet surroundings, respectively, with atmospheric models described in the previous section. The insets in each of the subplots zooms in on the profiles for the Mg II k region. Both the IRIS and the RH profiles were normalized to a reference intensity (Ic) as described in Sect. 4.2.
Current usage metrics show cumulative count of Article Views (full-text article views including HTML views, PDF and ePub downloads, according to the available data) and Abstracts Views on Vision4Press platform.
Data correspond to usage on the plateform after 2015. The current usage metrics is available 48-96 hours after online publication and is updated daily on week days.
Initial download of the metrics may take a while.