Fig. 7.
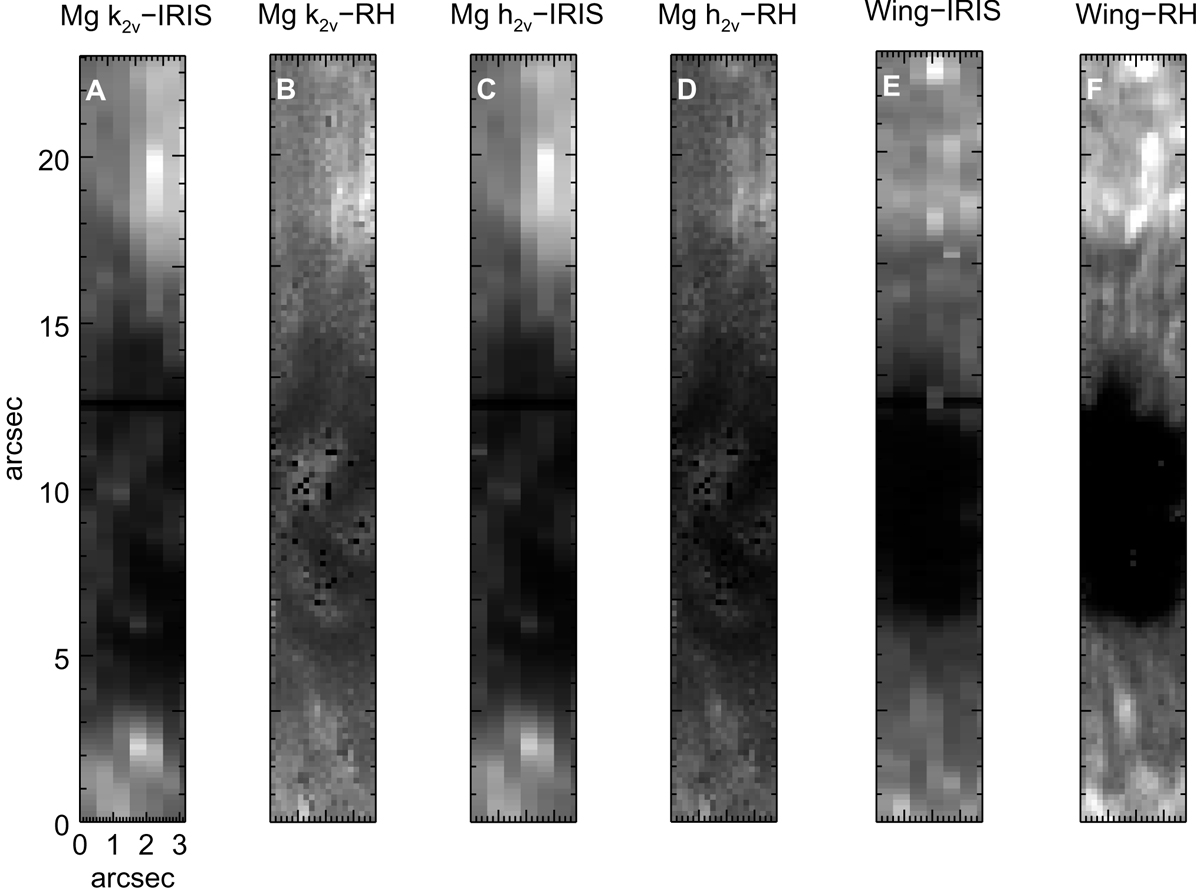
Comparison of the images obtained from the RH synthesis and images composed from the IRIS slit scan observations for the inverted FOV and for a narrow range of wavelengths: A: Mg k2v IRIS image, B: Mg k2v image obtained from RH1.5D synthesis, C: Mg h2v IRIS image, D: Mg h2v image obtained from RH1.5D synthesis, E: Mg II k wing image at 2794.7 Å from IRIS, and F: Mg II k wing image at 2794.7 Å from RH1.5D synthesis. The spectra were integrated over a definite wavelength window as described in Sect. 4.4. Each pair of images was scaled between a common intensity range for efficient comparisons.
Current usage metrics show cumulative count of Article Views (full-text article views including HTML views, PDF and ePub downloads, according to the available data) and Abstracts Views on Vision4Press platform.
Data correspond to usage on the plateform after 2015. The current usage metrics is available 48-96 hours after online publication and is updated daily on week days.
Initial download of the metrics may take a while.