Fig. B.1
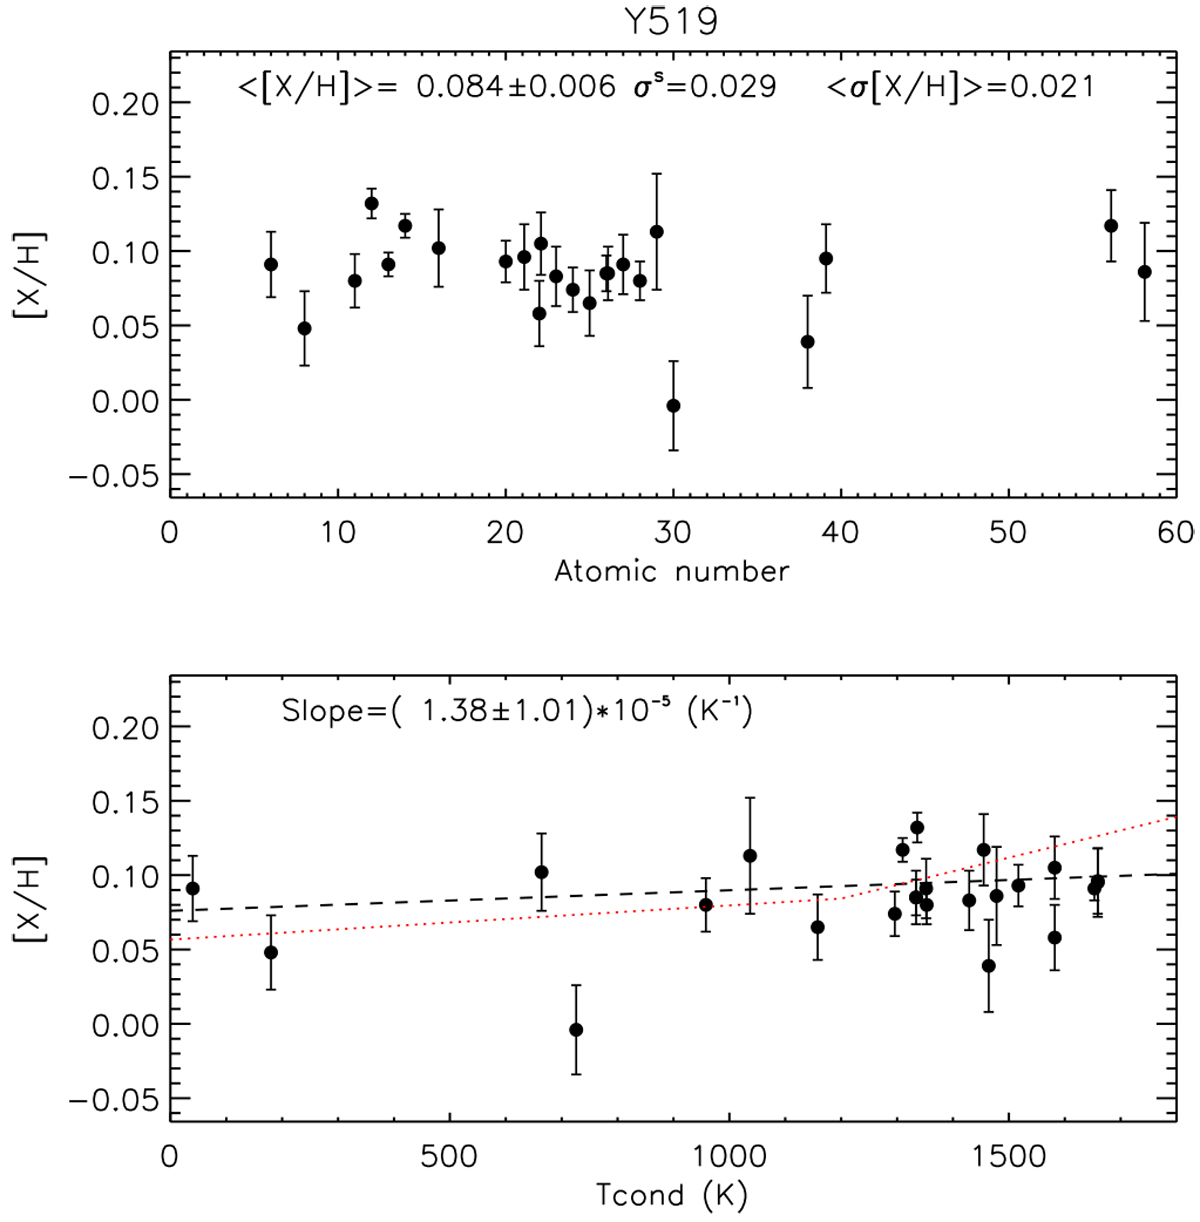
Top panel: differential abundances of subgiant star Y519 relative to the Sun as a function of atomic number. Bottom panel: differential abundances of Y519 relative to the Sun as a function of Tcond; the blue dashed line represents the linear least-squares fit to the data and the red dotted line represents the Tcond trend taken from Meléndez et al. (2009).
Current usage metrics show cumulative count of Article Views (full-text article views including HTML views, PDF and ePub downloads, according to the available data) and Abstracts Views on Vision4Press platform.
Data correspond to usage on the plateform after 2015. The current usage metrics is available 48-96 hours after online publication and is updated daily on week days.
Initial download of the metrics may take a while.