Fig. 14
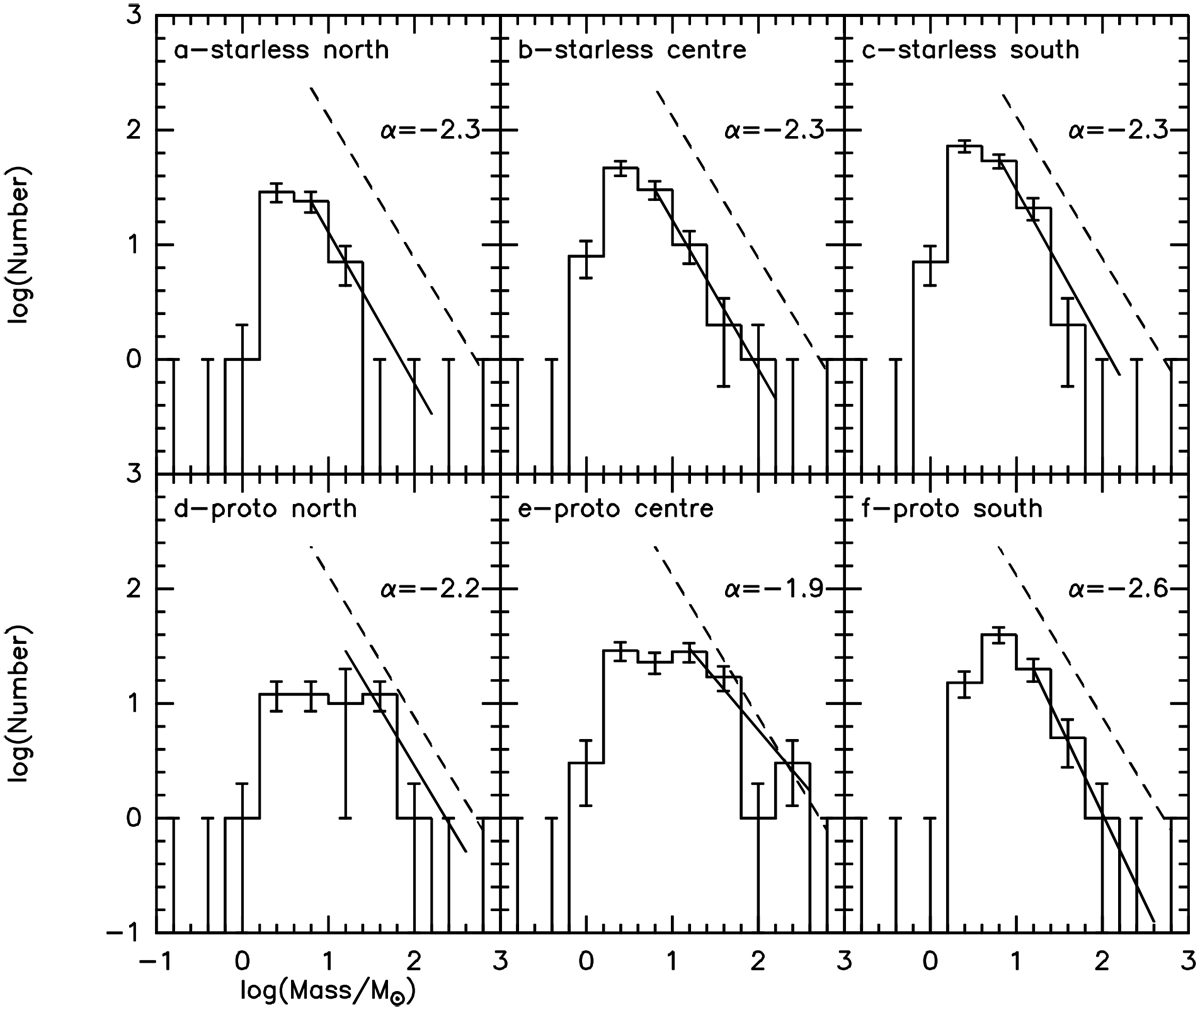
Comparison between core mass functions from the CuTEx starless and protostellar samples obtained in different parts of the cloud with a constant temperature of 12.5 K. Solid straight lines are linear fits to the high-mass ends, dashed straight lines show the slope found from the same fit to the total sample (starless plus protostellar; see Fig. 13a). a: only starless sources in the northern part (Dec > −43°10′); b: only starless sources in the central part (− 44°15′ < Dec < −43°10′); c: only starless sources in the southern part (Dec < −44°15′); d: only protostellar sources in the northern part (Dec > −43°10′); e: only protostellar sources in the central part (− 44°15′ < Dec < −43°10′); f: only protostellar sources in the southern part (Dec < −44°15′). Error bars indicate the Poissonian standard deviations of counts in each bin. Also indicated in each panel is the α index resulting from the linear fits, where dN∕dM ~ Mα.
Current usage metrics show cumulative count of Article Views (full-text article views including HTML views, PDF and ePub downloads, according to the available data) and Abstracts Views on Vision4Press platform.
Data correspond to usage on the plateform after 2015. The current usage metrics is available 48-96 hours after online publication and is updated daily on week days.
Initial download of the metrics may take a while.