Fig. 4
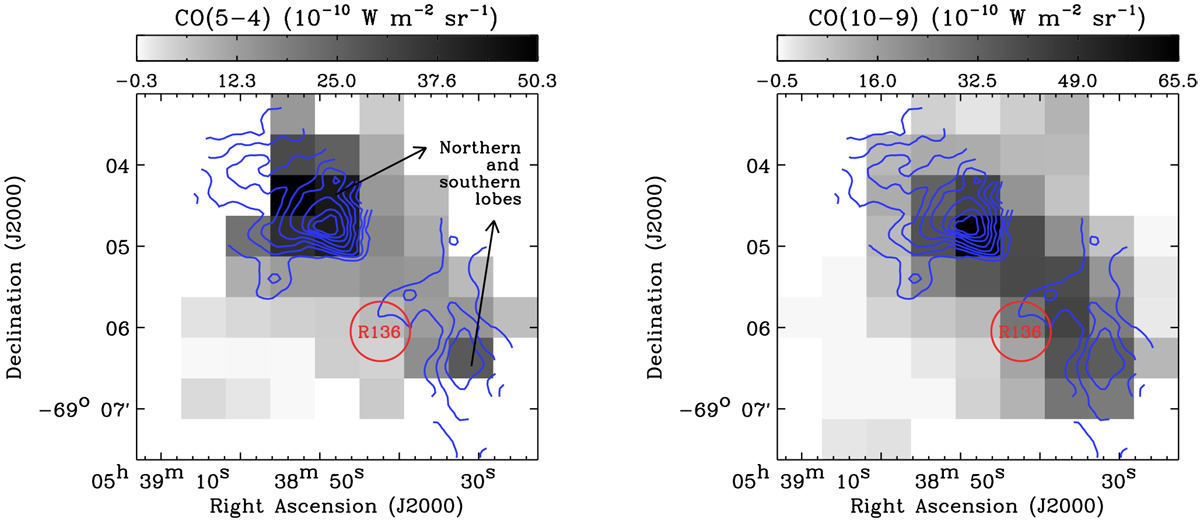
Comparison between CO (J = 5–4 and J = 10–9 on the left and right plots) and [C II] 158 μm (blue contours). The PACS [C II] 158 μm data at the original resolution of 12″ are overlaid with levels ranging from 20 to 90% of the peak (2.2 × 10⁻⁶ W m−2 sr−1) in steps of 10%. The location of the R136 cluster is indicated by the red circle. We note that the grayscale bar goes below zero simply to show pixels with low intensities.
Current usage metrics show cumulative count of Article Views (full-text article views including HTML views, PDF and ePub downloads, according to the available data) and Abstracts Views on Vision4Press platform.
Data correspond to usage on the plateform after 2015. The current usage metrics is available 48-96 hours after online publication and is updated daily on week days.
Initial download of the metrics may take a while.