Fig. 4
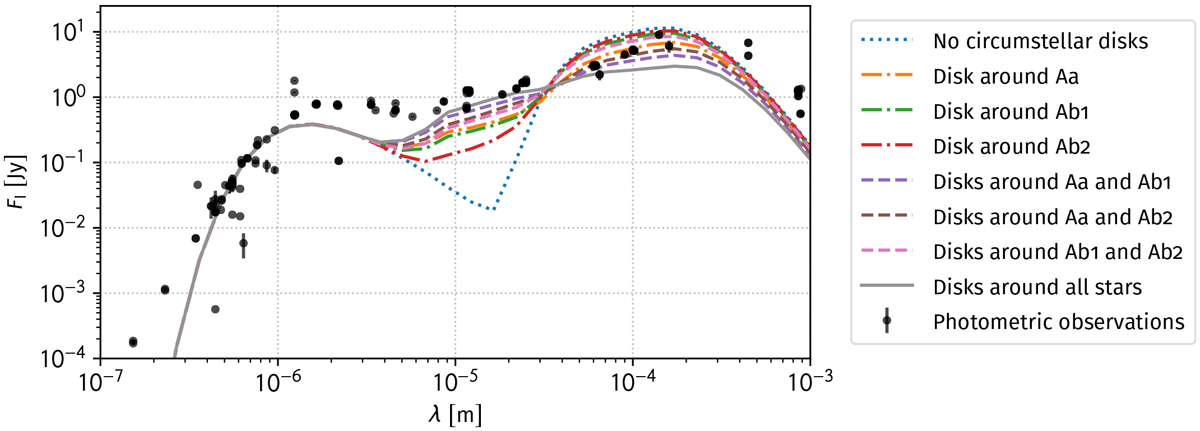
Spectral energy distribution of GG Tau A disk model. Each energy distribution considers a different combination of the circumstellar disks, but always takes the emission of the circumbinary disk as well as the emission from all three stars into account (see Table 2). For comparison purposes with the observations, the foreground reddening was applied to the simulated spectral energy distributions (AV = 0.3, Hartigan & Kenyon 2003). The black dots are photometric measurements obtained from the VizieR catalog service (see Appendix A).
Current usage metrics show cumulative count of Article Views (full-text article views including HTML views, PDF and ePub downloads, according to the available data) and Abstracts Views on Vision4Press platform.
Data correspond to usage on the plateform after 2015. The current usage metrics is available 48-96 hours after online publication and is updated daily on week days.
Initial download of the metrics may take a while.