Fig. 6
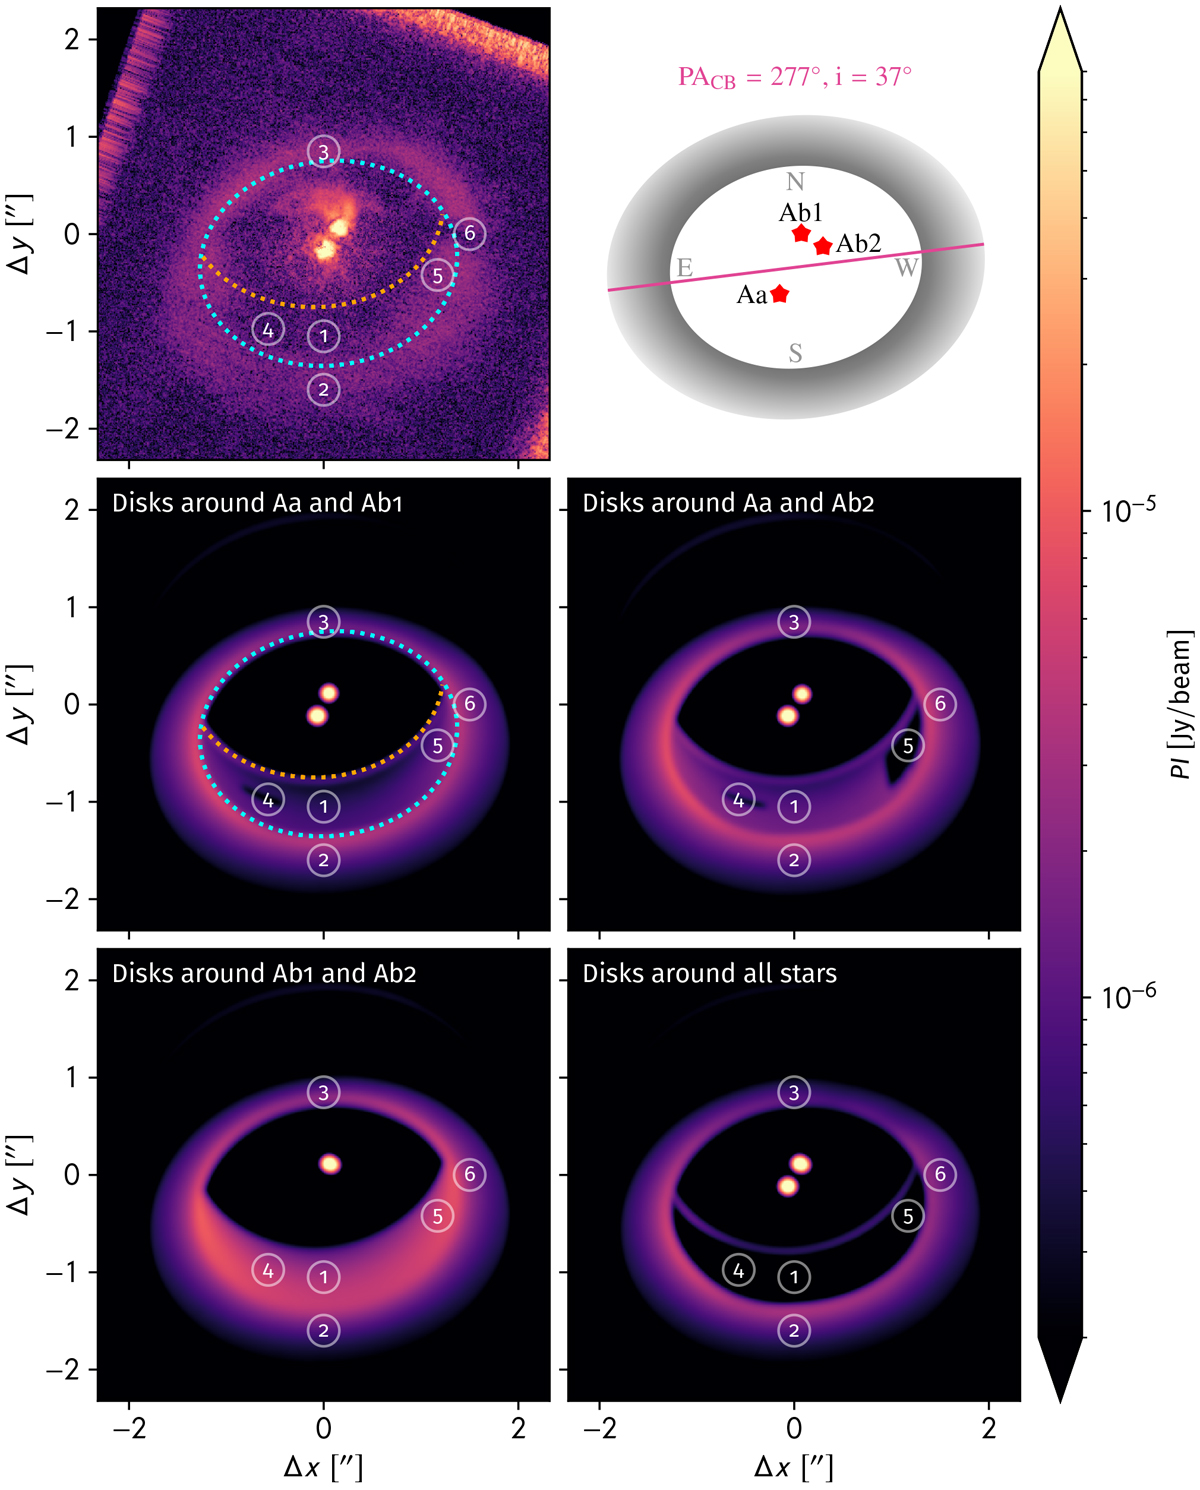
Top left: polarized intensity observation of GG Tau A in near-infrared (H-Band) with Subaru/HiCIAO (Yang et al. 2017). The uncalibrated observation was fit visually to the simulated emission maps by assuming a linear photon count. The inner wall of the CB disk is illustrated by ellipses that are fit to the transition from the inner edge to the upper layers of the CB disk as seen in the simulations(see center left). Other images: polarized intensity maps of GG Tau A that are simulated at λ = 1.65 μm. The images are convolved with a Gaussian beam of 0.07′′ ×0.07′′ to take the resolution of the Subaru/HiCIAO telescope into account. Each simulated map considers a different combination of circumstellar disks around GG Tau Aa, Ab1, and Ab2 to investigate their individual influence on the emission of the circumbinary disk (see Table 2).
Current usage metrics show cumulative count of Article Views (full-text article views including HTML views, PDF and ePub downloads, according to the available data) and Abstracts Views on Vision4Press platform.
Data correspond to usage on the plateform after 2015. The current usage metrics is available 48-96 hours after online publication and is updated daily on week days.
Initial download of the metrics may take a while.