Fig. 7
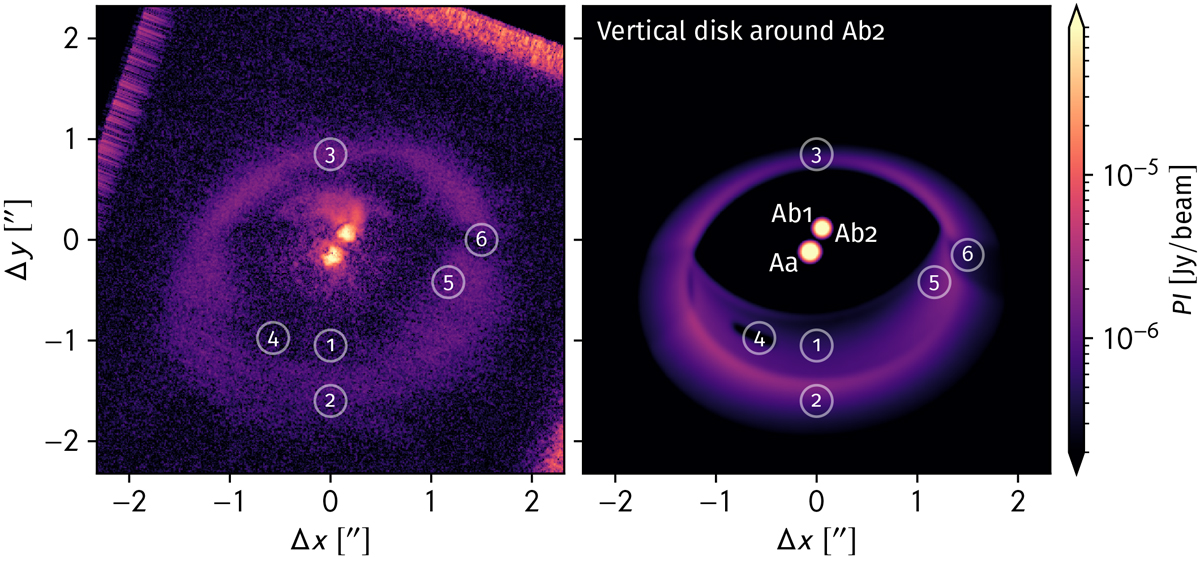
Left: polarized intensity observation of GG Tau A in near-infrared (H-Band) with Subaru/HiCIAO (Yang et al. 2017). The uncalibrated observation was fit visually to the simulated emission maps by assuming a linear photon count. Right: polarized intensity map of GG Tau A that is simulated at λ = 1.65 μm. The image isconvolved with a Gaussian beam of 0.07′′ ×0.07′′ to take the resolution of the Subaru/HiCIAO telescope into account. The model consists of disks around Aa and Ab1 in the same plane as the circumbinary disk and a disk around Ab2 that is inclined by 90 ° with a position angle of the rotation axis of 270° (see Fig. 2). An increased grid resolution and sightly larger scale height of the CS disk around Aa was required to achieve the sharp western shadow.
Current usage metrics show cumulative count of Article Views (full-text article views including HTML views, PDF and ePub downloads, according to the available data) and Abstracts Views on Vision4Press platform.
Data correspond to usage on the plateform after 2015. The current usage metrics is available 48-96 hours after online publication and is updated daily on week days.
Initial download of the metrics may take a while.