Table 8
Overview of ratios between emission at different positions in polarized emission maps (see Figs. 5–7 and Table 2).
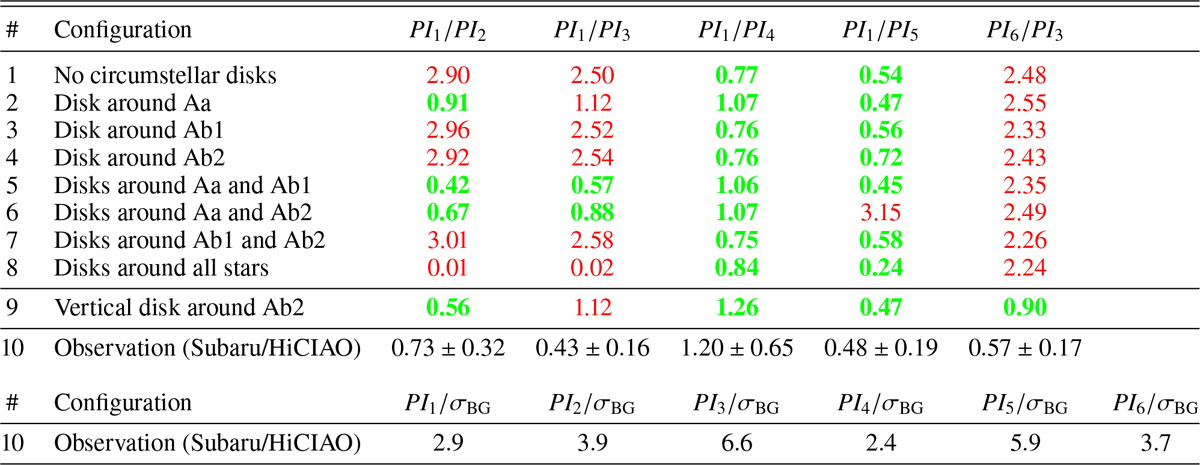
Notes. We obtained the uncertainty of the emission ratios by calculating the standard deviation of the background noise in the observation. In addition, the ratio between the emission of each region and the background noise is shown for the observation at the bottom of the table (background noise: PIBG∕σBG ~ 2). Each emission ratio that is inside of two sigma of the observed ratio is marked in green (bold) and each other ratio is marked in red (normal).
Current usage metrics show cumulative count of Article Views (full-text article views including HTML views, PDF and ePub downloads, according to the available data) and Abstracts Views on Vision4Press platform.
Data correspond to usage on the plateform after 2015. The current usage metrics is available 48-96 hours after online publication and is updated daily on week days.
Initial download of the metrics may take a while.