Fig. 16.
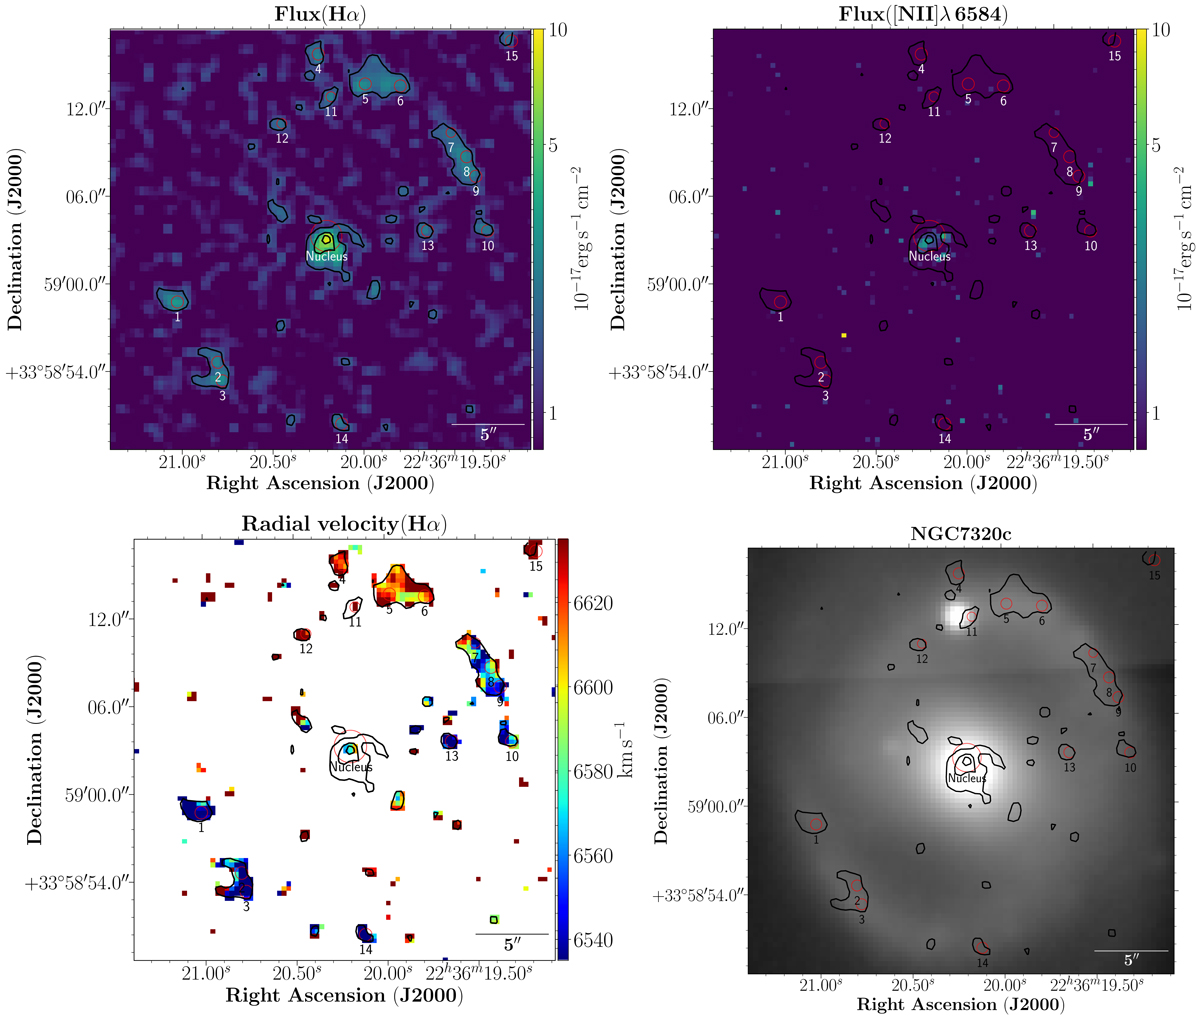
NGC 7320c Hα flux spatial map (upper left panel), [N II]λ6584 flux spatial map (upper right panel), Hα radial velocity map considering pixels with contrast (Hα) ≥ 2.5 (lower left panel), and deep image from SN2 filter (lower right panel). Red circles represent the locations of the NGC 7320c nucleus and 15 Hα emission regions from its spiral arms. The black contours are 1.5 × 10⁻¹⁷, 4 × 10⁻¹⁷, and 7 × 10⁻¹⁷ erg s−1 cm−2.
Current usage metrics show cumulative count of Article Views (full-text article views including HTML views, PDF and ePub downloads, according to the available data) and Abstracts Views on Vision4Press platform.
Data correspond to usage on the plateform after 2015. The current usage metrics is available 48-96 hours after online publication and is updated daily on week days.
Initial download of the metrics may take a while.