Fig. 4.
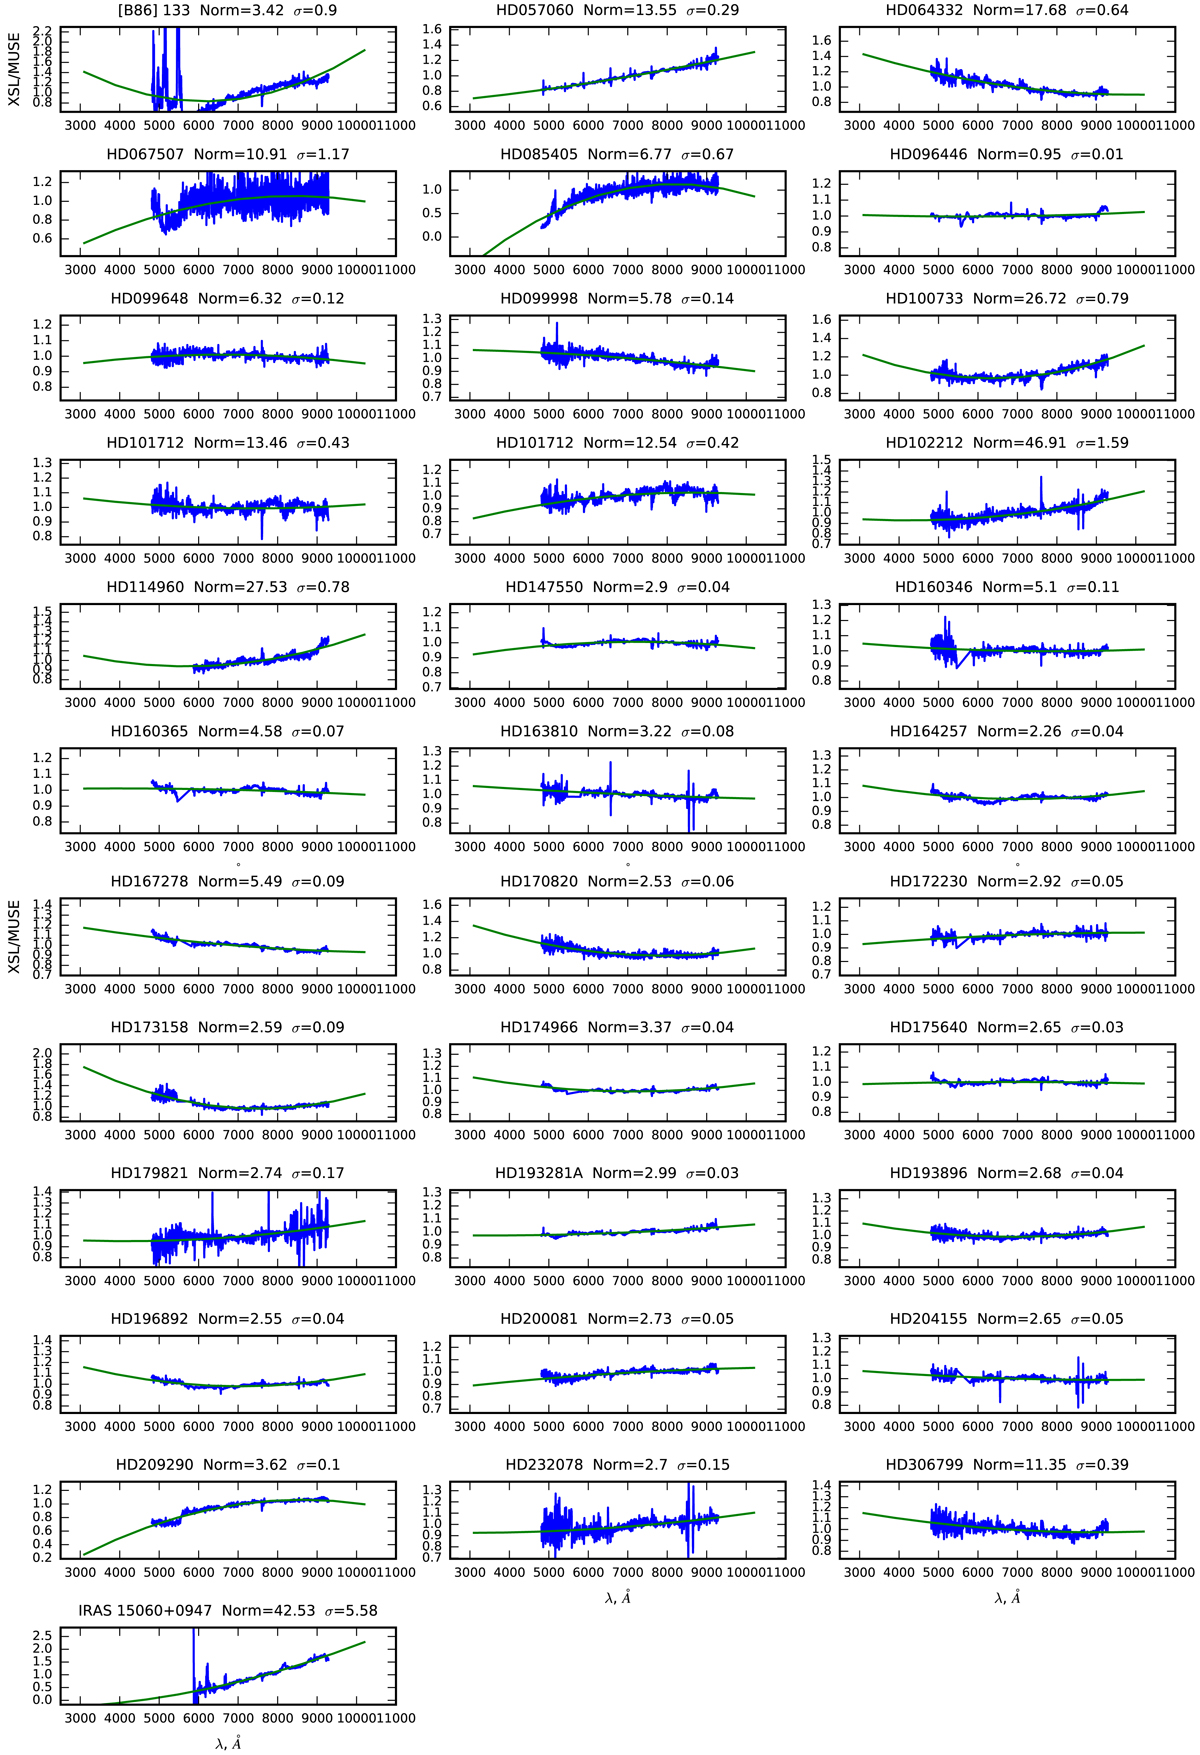
Ratios of the XSL spectra to our MUSE spectra (blue; covers only the MUSE wavelength range), normalized to unity and median smoothed for display purposes with a five-element wide median filter. Two ratios are shown for HD 101712 – for the two XSL spectra of this star. A second-order polynomial fit spanning the wavelength of XSL is also shown in blue. The labels on the top of each panel contain the name of the object, the normalization factor that indicates the flux ratio of the independently flux-calibrated MUSE and XSL spectra, and a standard deviation of the residuals of the fit. The coefficients of polynomial fits are listed in Table B.1.
Current usage metrics show cumulative count of Article Views (full-text article views including HTML views, PDF and ePub downloads, according to the available data) and Abstracts Views on Vision4Press platform.
Data correspond to usage on the plateform after 2015. The current usage metrics is available 48-96 hours after online publication and is updated daily on week days.
Initial download of the metrics may take a while.