Fig. 8
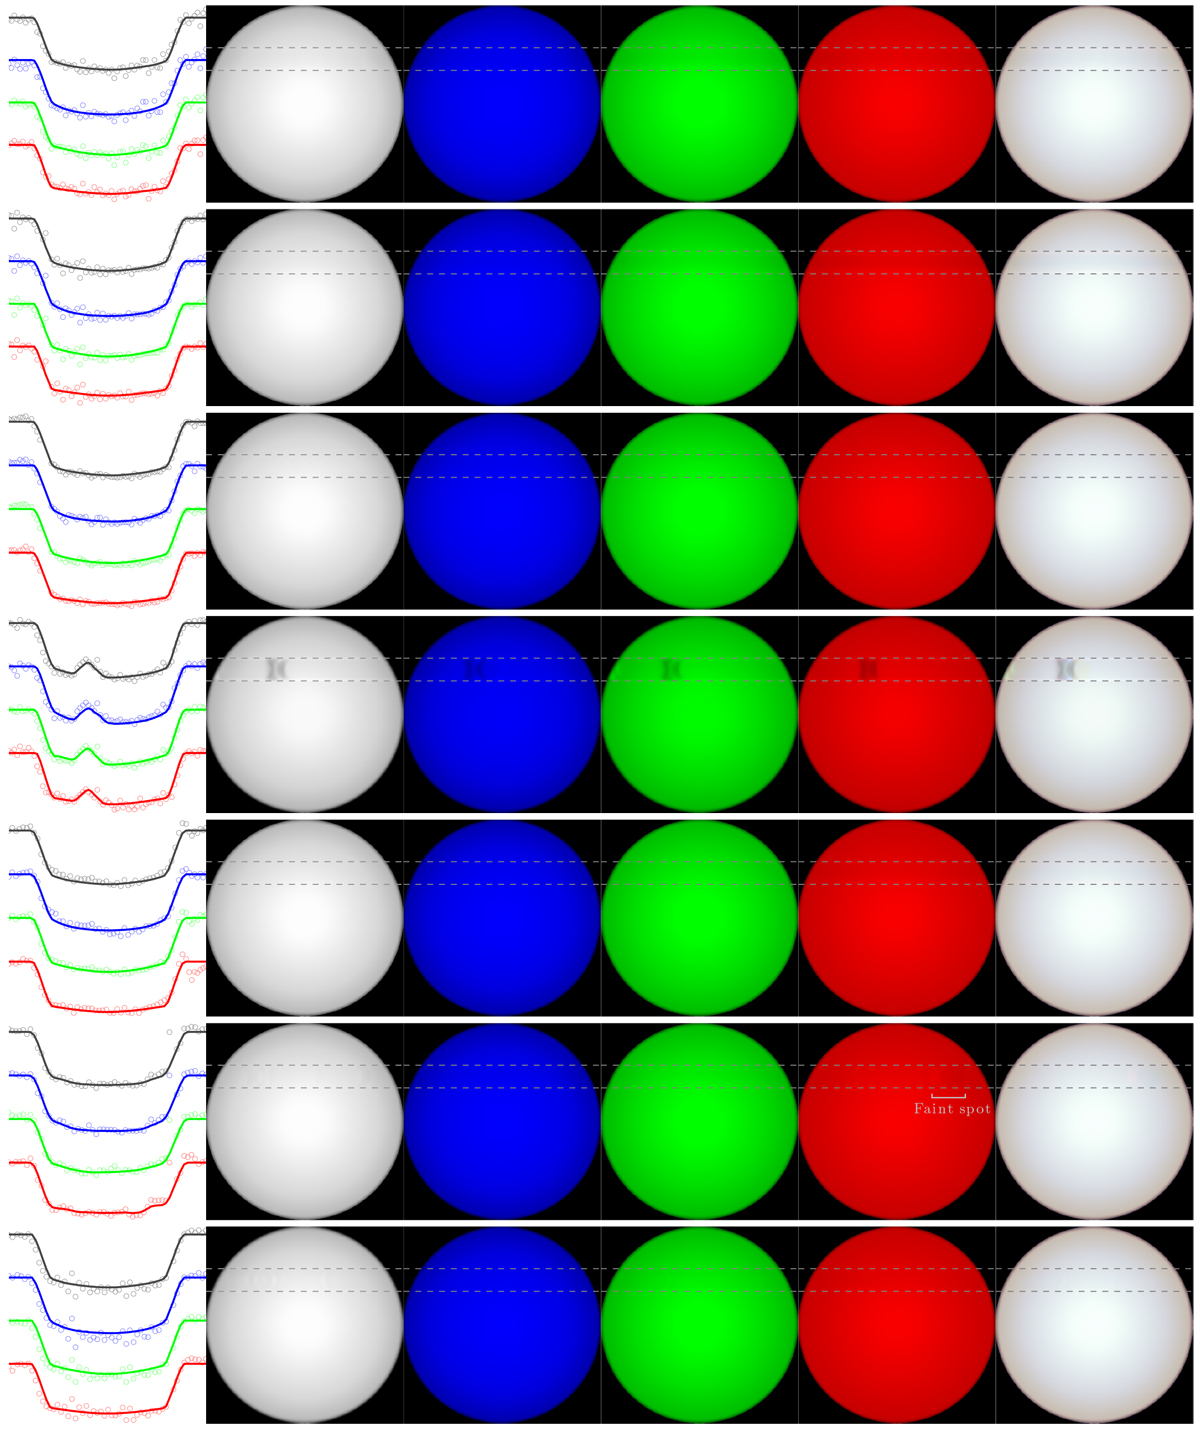
Recovered maps of GJ 1214. Each row is a single transit event that is divided into five panels. First panel from the left: transit light curves. Circles show observed data, and the solid lines present the light curve produced by the recovered maps. There are four light curves in each plot. The upper curve in gray shows observations from all wavelengths, while the lower three curve show the data from the three wavelength bins (short wavelengths in blue, intermediate in green, and long in red). Second to fifth panels: reconstructed surface maps in the same wavelength bins as the light curves. From left to right panels: all wavelengths, short wavelengths, intermediate wavelengths, and long wavelengths. The rightmost stellar map is a color-composite of the blue, green, and red maps. In all maps the dashed gray lines show the transit chord. Observations of this system were made in 0.73–1.02 μm. A dark spot (or group of spots) was detected in the fourth transit. A faint spot is detected in the red wavelengths of the sixth transit.
Current usage metrics show cumulative count of Article Views (full-text article views including HTML views, PDF and ePub downloads, according to the available data) and Abstracts Views on Vision4Press platform.
Data correspond to usage on the plateform after 2015. The current usage metrics is available 48-96 hours after online publication and is updated daily on week days.
Initial download of the metrics may take a while.