Fig. 3
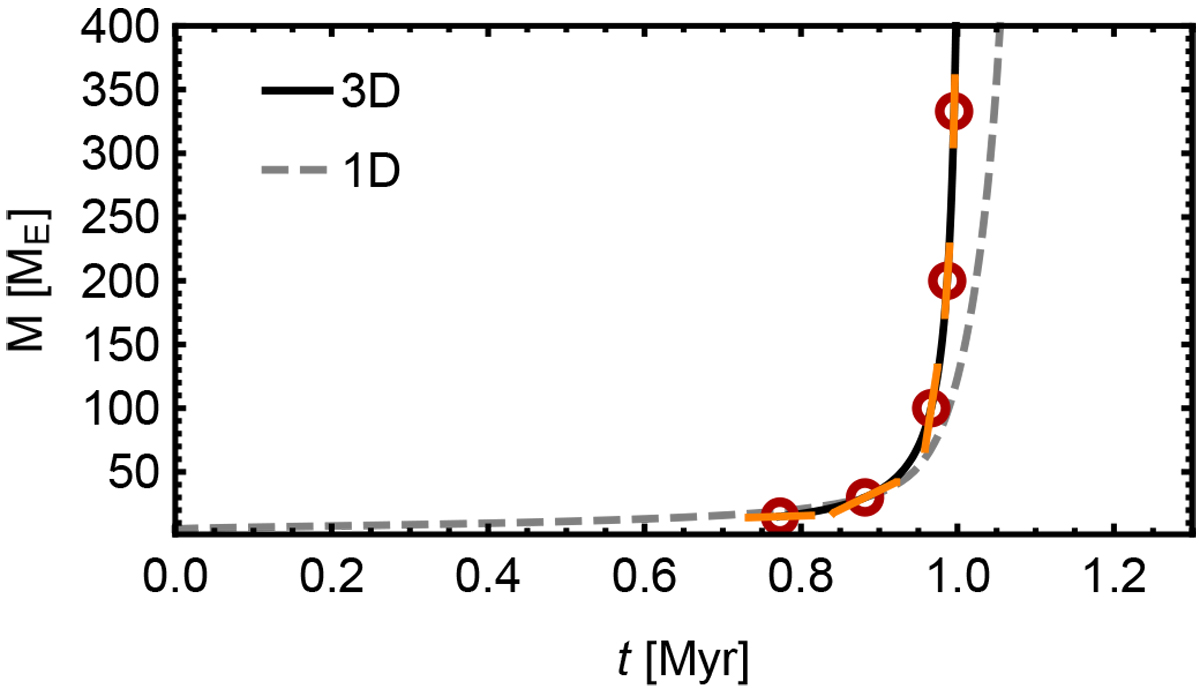
Evolution of the planetary mass as function of time, based on the snapshot accretion rates of our hydrodynamical simulations (black curve). Red circles mark the masses where hydrodynamical simulations were performed. The measured accretion rate of each simulation is indicated by the orange slope segment. Growth from a 15ME-planet to a Jupiter-mass planet is completed in about 2 × 10⁵ yr. The grey dashed curve represents the 1D model, illustrating a significant fraction of envelope growth may be spend at low envelope masses.
Current usage metrics show cumulative count of Article Views (full-text article views including HTML views, PDF and ePub downloads, according to the available data) and Abstracts Views on Vision4Press platform.
Data correspond to usage on the plateform after 2015. The current usage metrics is available 48-96 hours after online publication and is updated daily on week days.
Initial download of the metrics may take a while.