Free Access
Fig. 10
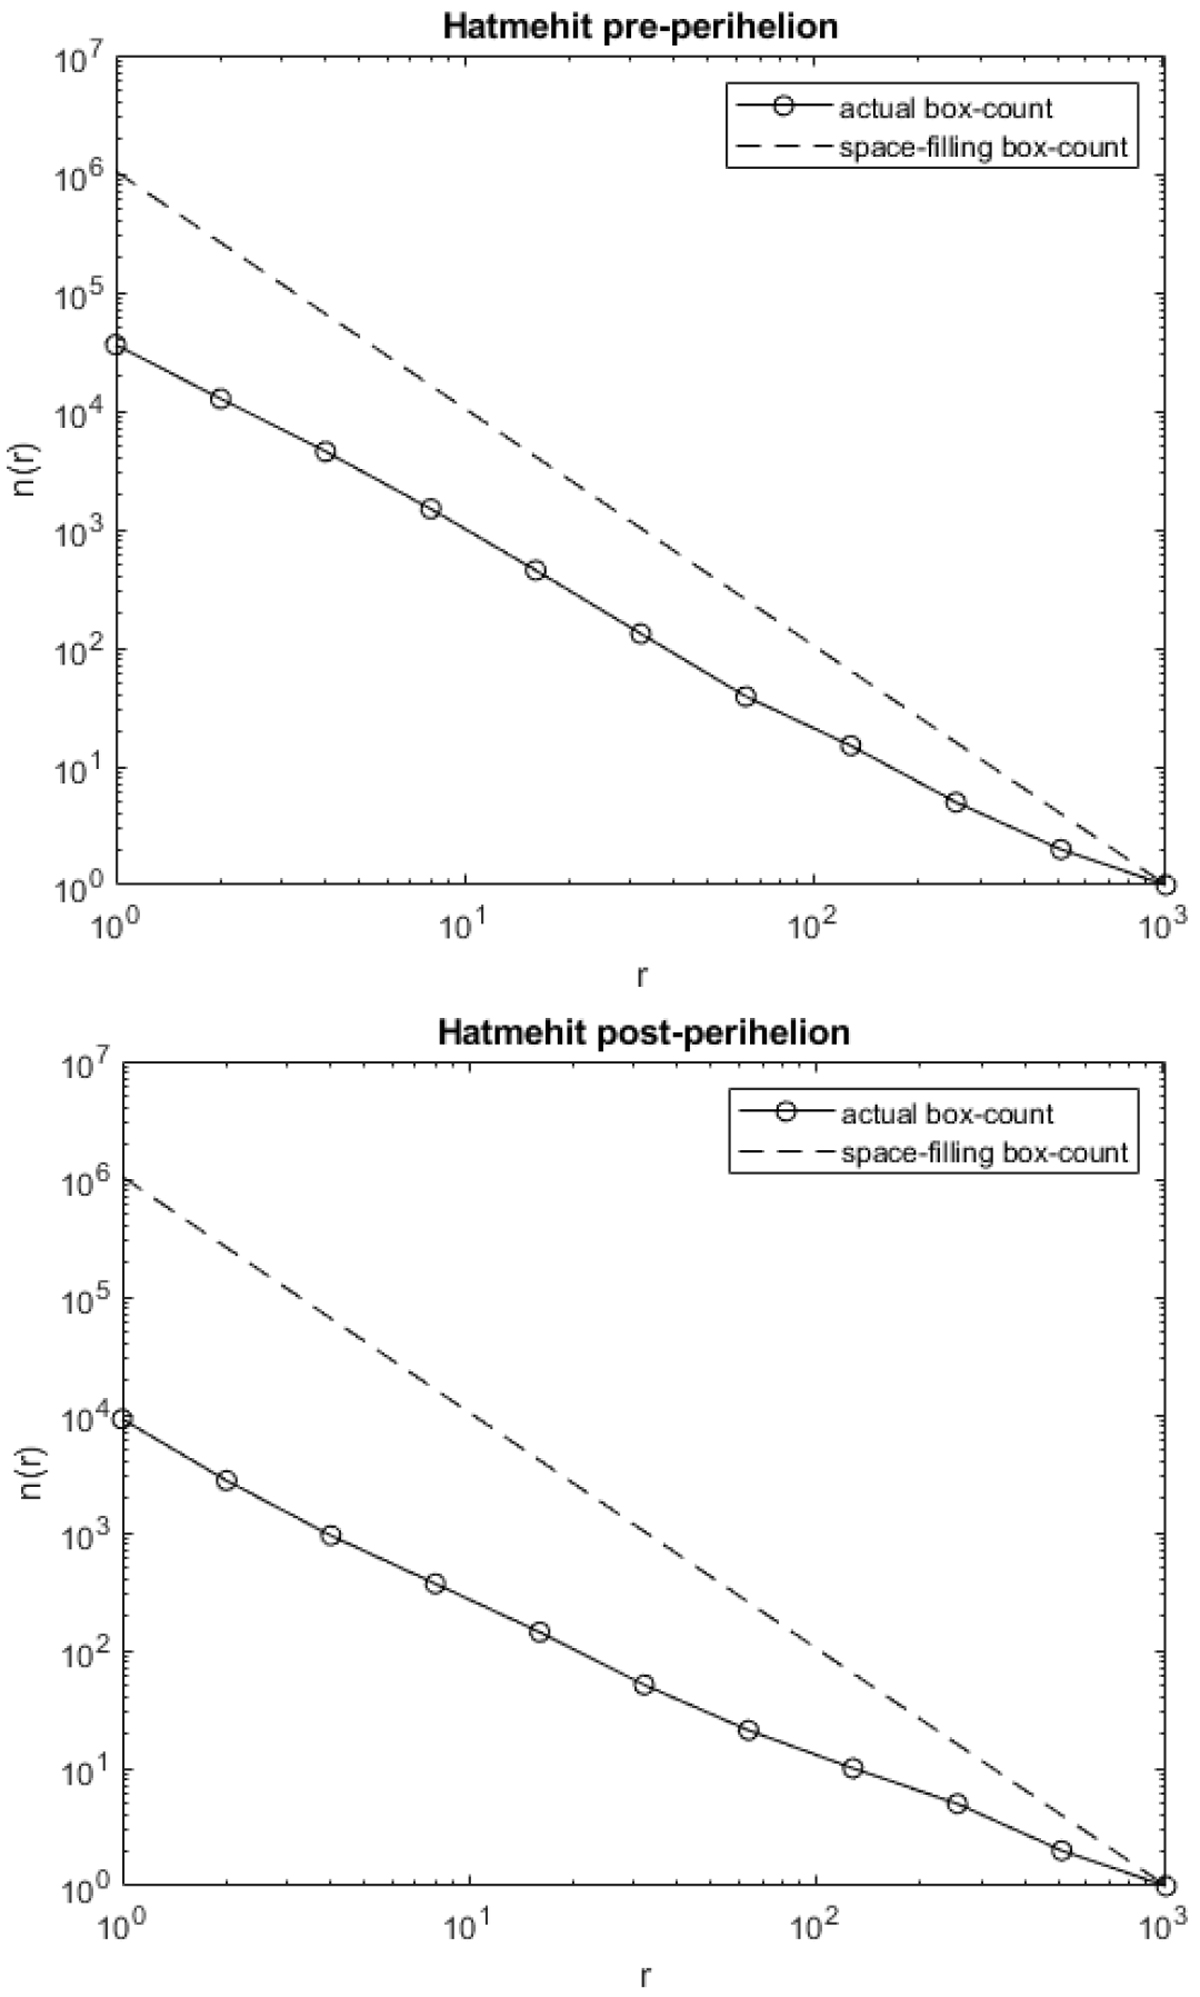
Results of the box-count method for the Hatmehit region. The dashed line shows the scaling n ∝ r−2 expected for a space-filling 2D image. The solid line represents the power law N = N0r−Df. The possible fractal behavior of the dataset is indicated by the discrepancy between the two curves.
Current usage metrics show cumulative count of Article Views (full-text article views including HTML views, PDF and ePub downloads, according to the available data) and Abstracts Views on Vision4Press platform.
Data correspond to usage on the plateform after 2015. The current usage metrics is available 48-96 hours after online publication and is updated daily on week days.
Initial download of the metrics may take a while.