Fig. 15
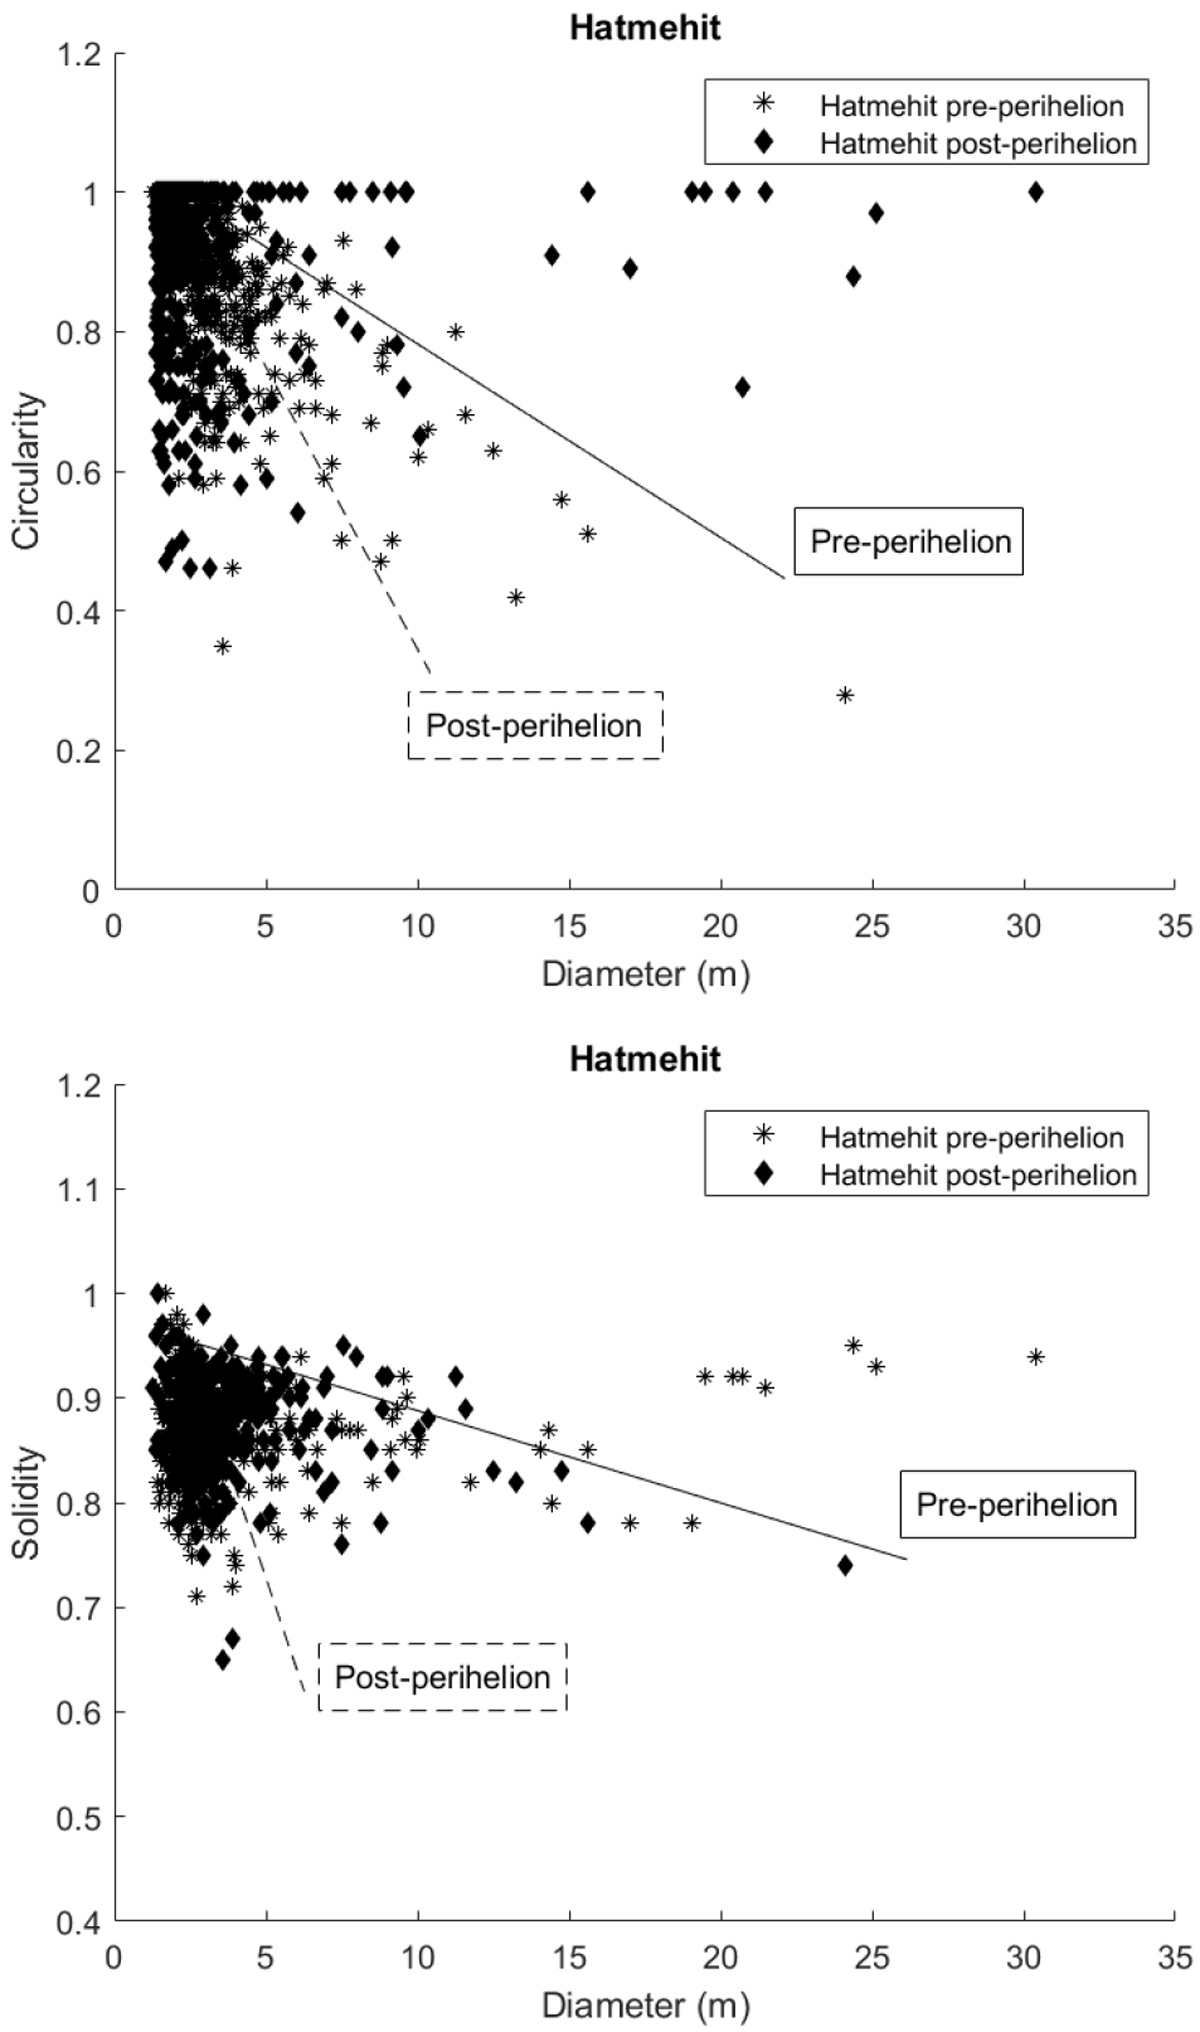
Comparison between circularity, solidity, and boulder size. Upper panel: circularity. Lower panel: solidity. The stars represent the Hatmehit pre-perihelion case (the solid line is the corresponding trend line), and the diamond represents the Hatmehit post-perihelion case. The dotted trend line refers to the post-perihelion case.
Current usage metrics show cumulative count of Article Views (full-text article views including HTML views, PDF and ePub downloads, according to the available data) and Abstracts Views on Vision4Press platform.
Data correspond to usage on the plateform after 2015. The current usage metrics is available 48-96 hours after online publication and is updated daily on week days.
Initial download of the metrics may take a while.