Fig. 1
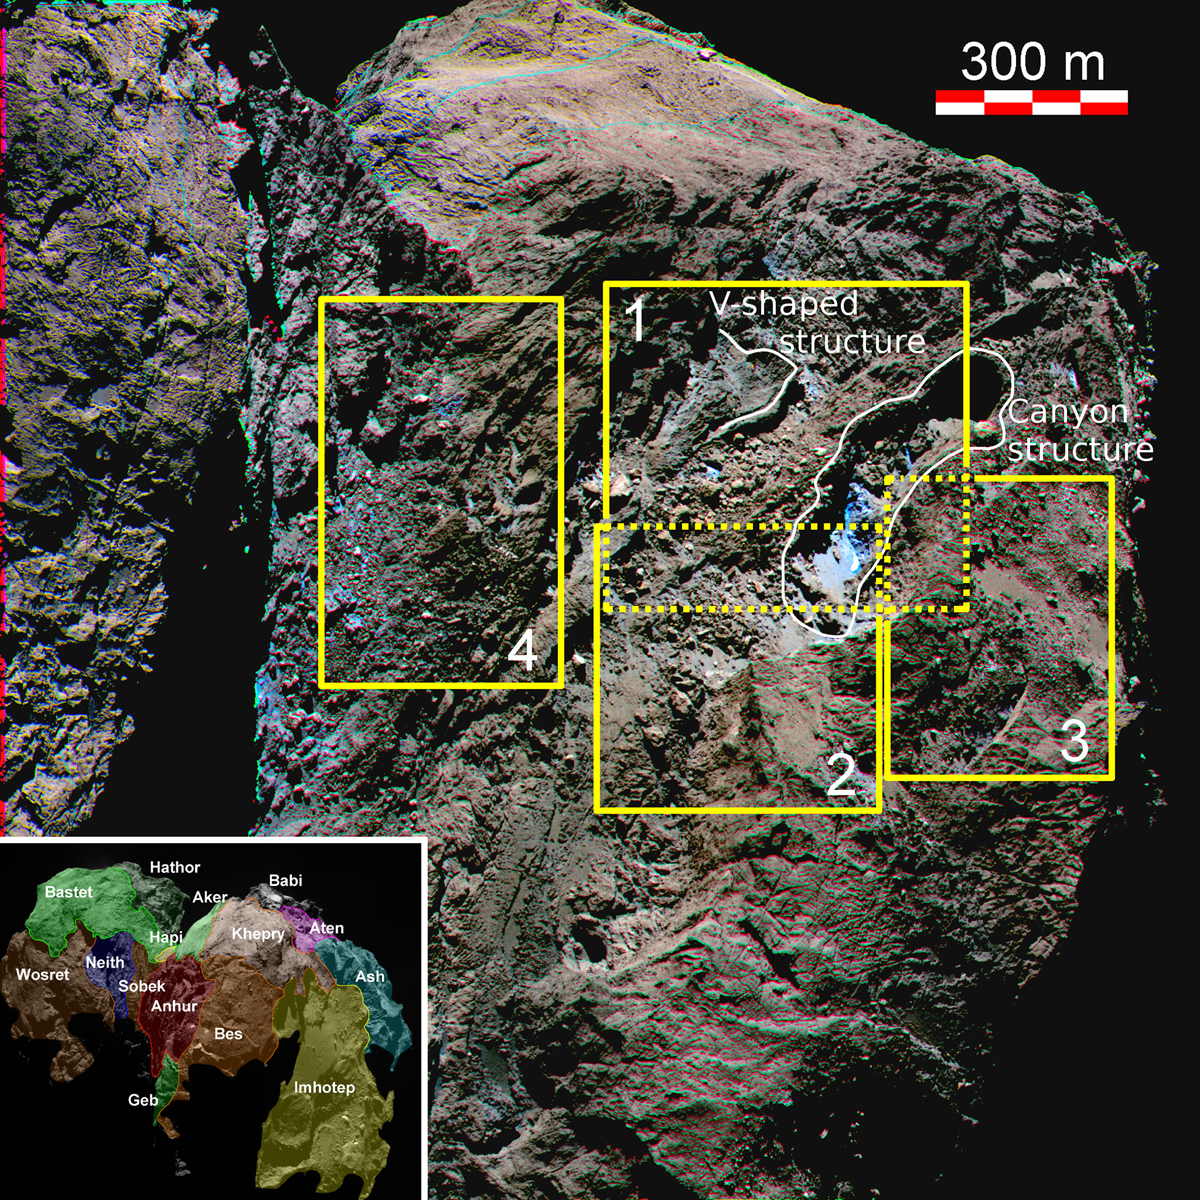
RGB map from images obtained on 10 February 2016, UT 08h14, showing the Anhur region. The yellow rectangles indicate theposition of the subregions analyzed in Figs. 2, 7, 8, and 10. The so-called V-shaped layered terrain and the canyon-like structure are also indicated. In the bottom left corner, we insert a 3D view of the southern hemisphere of 67P and overlay regional boundaries to facilitate locating the Anhur region on the nucleus.
Current usage metrics show cumulative count of Article Views (full-text article views including HTML views, PDF and ePub downloads, according to the available data) and Abstracts Views on Vision4Press platform.
Data correspond to usage on the plateform after 2015. The current usage metrics is available 48-96 hours after online publication and is updated daily on week days.
Initial download of the metrics may take a while.