Fig. A.1
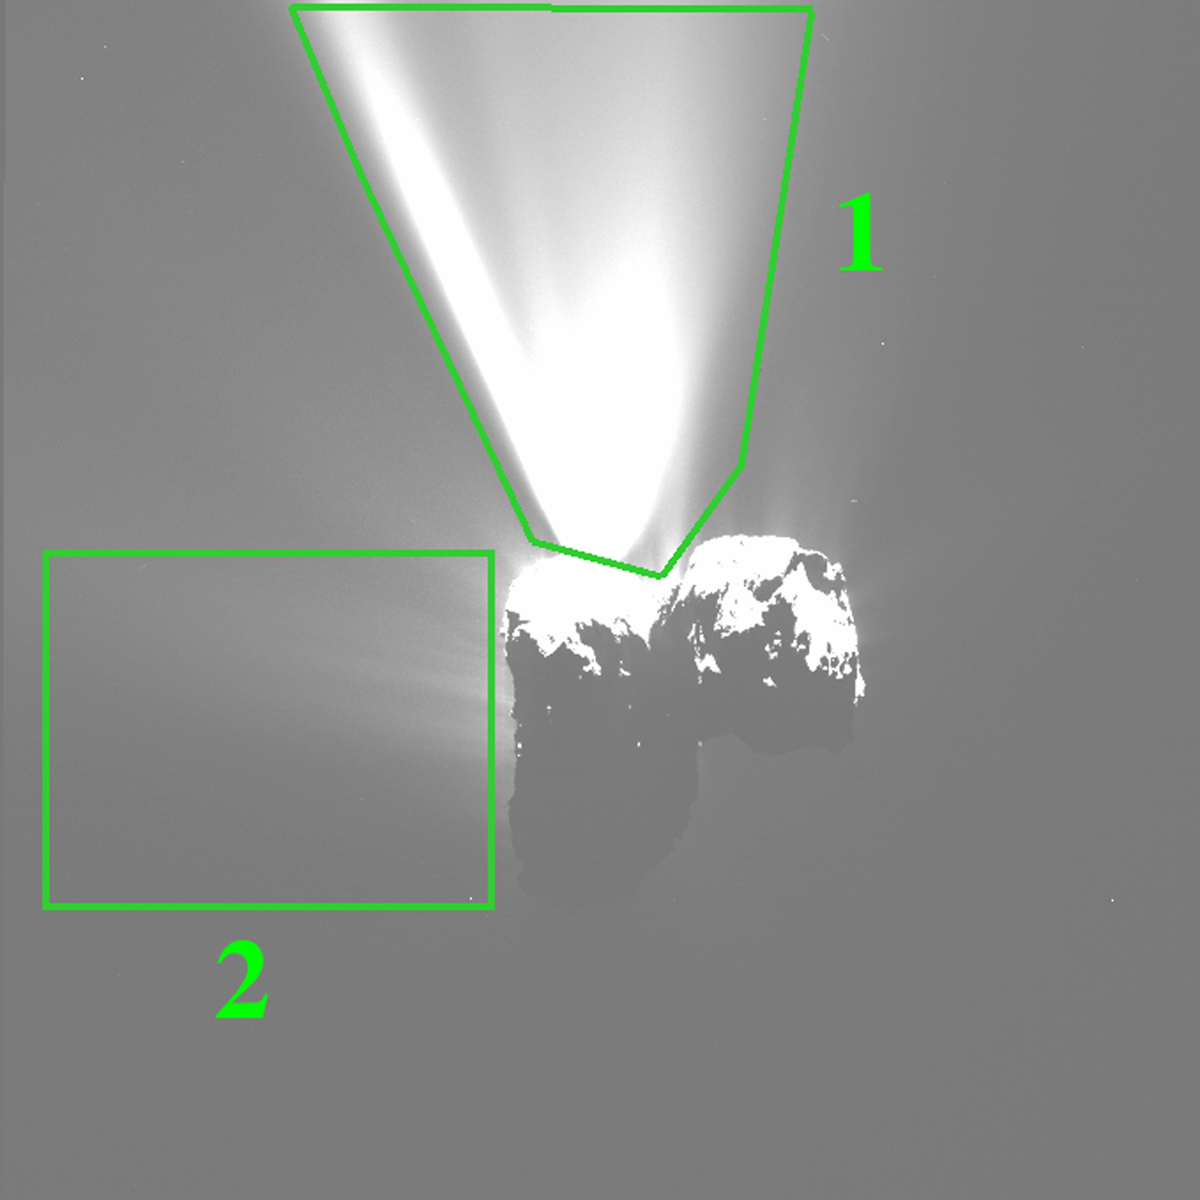
Image of the perihelion outburst acquired with the orange filter on 12 August 2015 UT17:20:02. Contrast has been stretched to highlight the brightness profile of the outburst. The green boxes represent the full bright area of the event (number 1) and the control area (number 2) that contains the flux contribution of the quiescent coma between the body and the spacecraft.
Current usage metrics show cumulative count of Article Views (full-text article views including HTML views, PDF and ePub downloads, according to the available data) and Abstracts Views on Vision4Press platform.
Data correspond to usage on the plateform after 2015. The current usage metrics is available 48-96 hours after online publication and is updated daily on week days.
Initial download of the metrics may take a while.