Fig. 5.
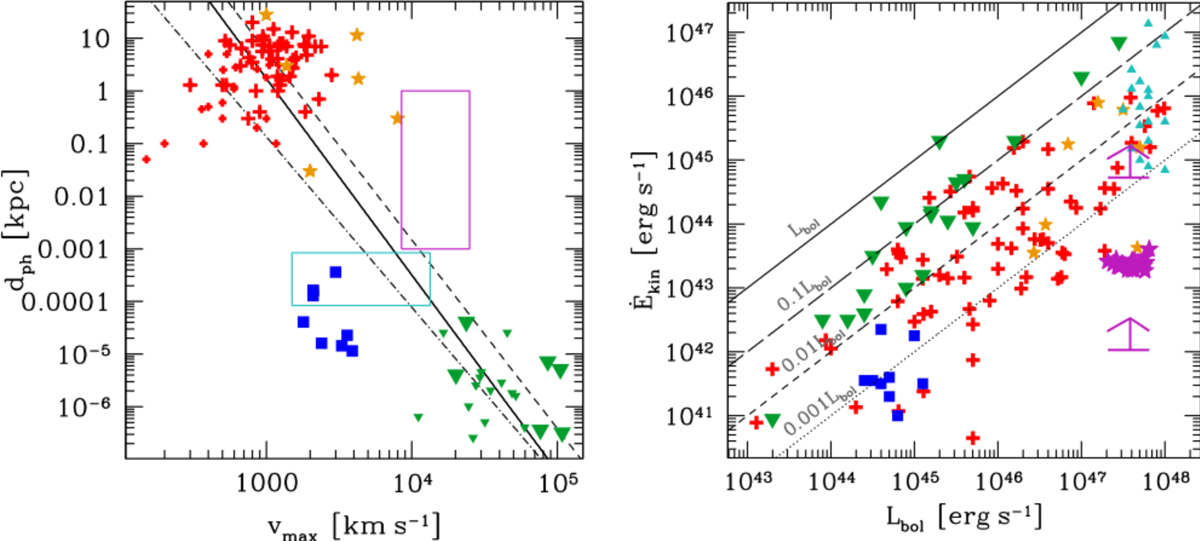
Left panel: physical distance (dph) of the high-velocity outflow component as a function of vmax for the same sources as in Fig. 4 and belonging to the Fiore et al. (2017) sample. Large and small symbols for molecular and ionised kiloparsec-scale outflows (red crosses) and UFOs (green triangles) represent sources whose bolometric output is higher and lower than log(Lbol/erg s−1) = 45.5. Solid, dot-dashed, and dashed lines report the linear relations connecting the average points of kiloparsec-scale outflows and UFOs for all sources and sources fainter and brighter than log(Lbol/erg s−1) = 45.5, respectively. The position occupied by WISSH BALs and C IV broad emission line winds is reported with magenta and cyan rectangular regions, respectively (see text for details). Right panel: kinetic power as a function of bolometric luminosity for the sources reported in Fig. 4. The two lower limits represent our uncertainty on the BAL column density (see text for details).
Current usage metrics show cumulative count of Article Views (full-text article views including HTML views, PDF and ePub downloads, according to the available data) and Abstracts Views on Vision4Press platform.
Data correspond to usage on the plateform after 2015. The current usage metrics is available 48-96 hours after online publication and is updated daily on week days.
Initial download of the metrics may take a while.