Fig. A.1.
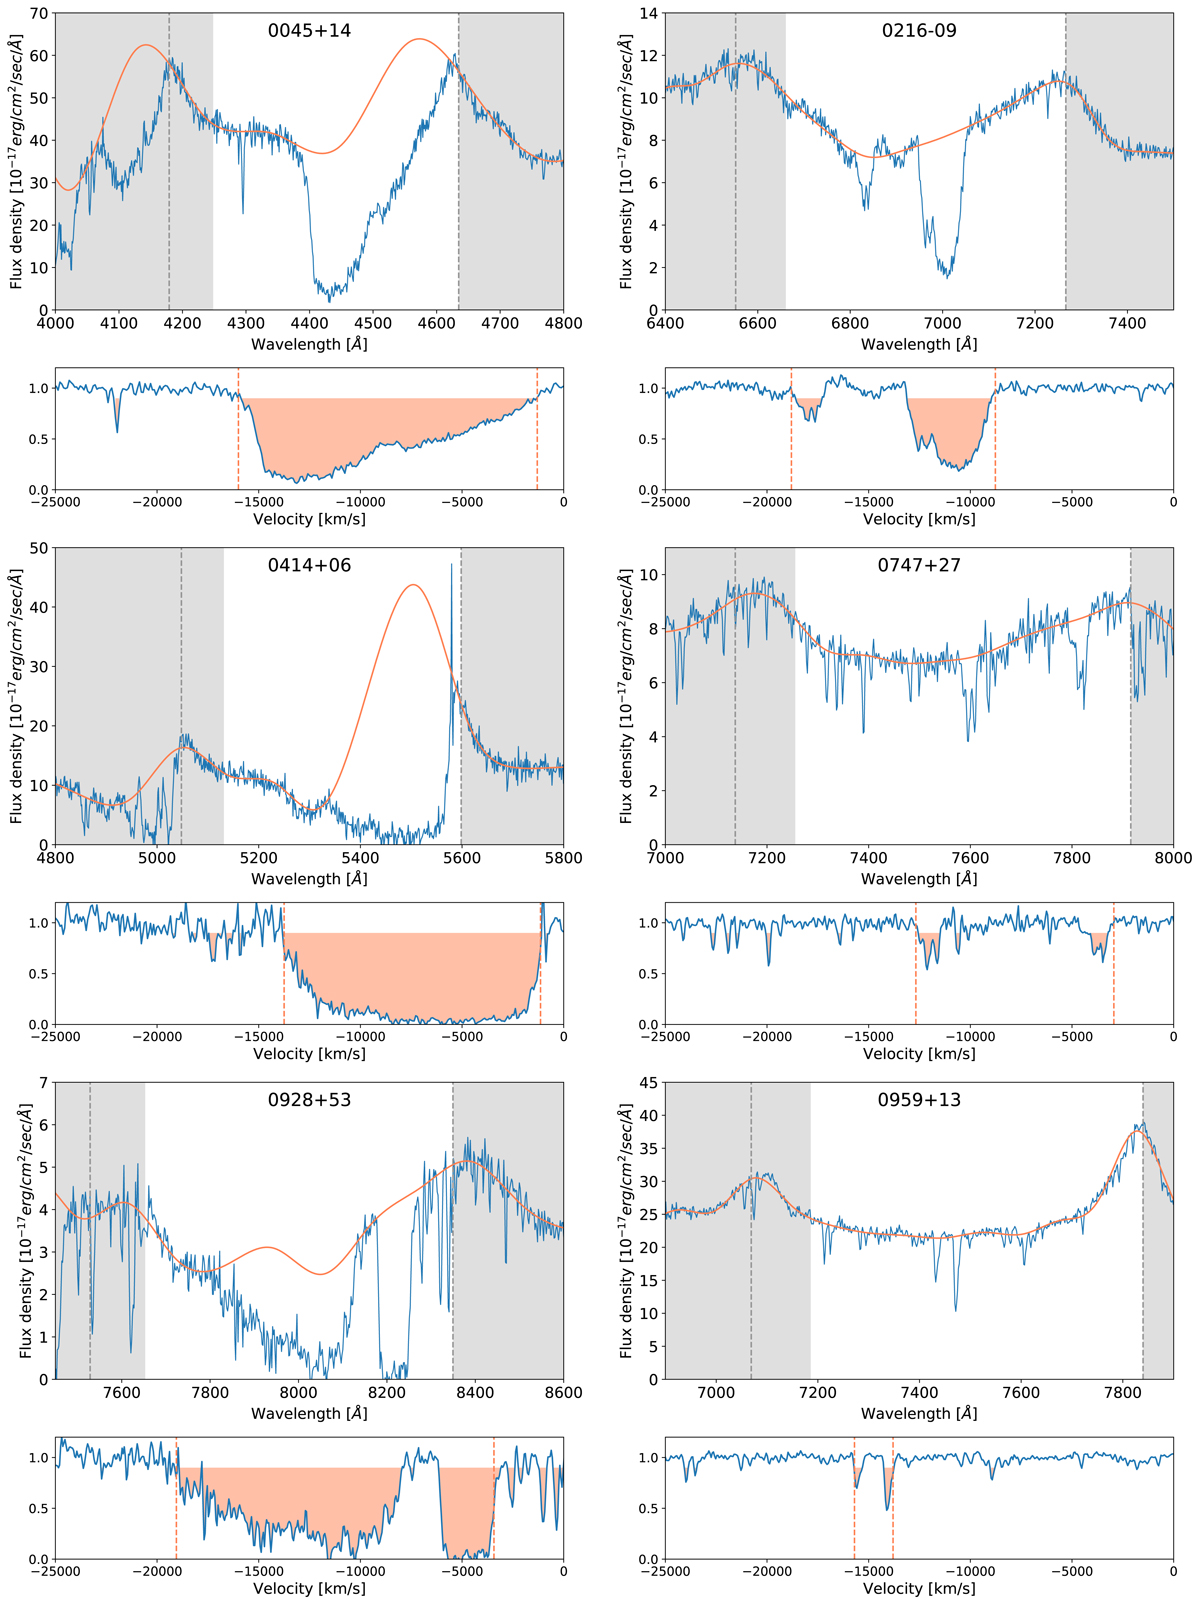
SDSS DR12 spectra of the 38 BAL QSOs presented here. Top panel: spectrum (blue line) and fit performed in IRAF (orange line); dashed lines indicate the position of the Si IV and C IV peaks as calculated from redshift, and the white area denotes the wavelength interval between 0 and −25 000 km s−1. Bottom panel: residuals between the C IV peak and −25 000 km s−1; absorption below 90% of the continuum is highlighted in orange; the dashed lines indicate the minimum and maximum velocity estimated for the BAL outflow.
Current usage metrics show cumulative count of Article Views (full-text article views including HTML views, PDF and ePub downloads, according to the available data) and Abstracts Views on Vision4Press platform.
Data correspond to usage on the plateform after 2015. The current usage metrics is available 48-96 hours after online publication and is updated daily on week days.
Initial download of the metrics may take a while.