Fig. 1
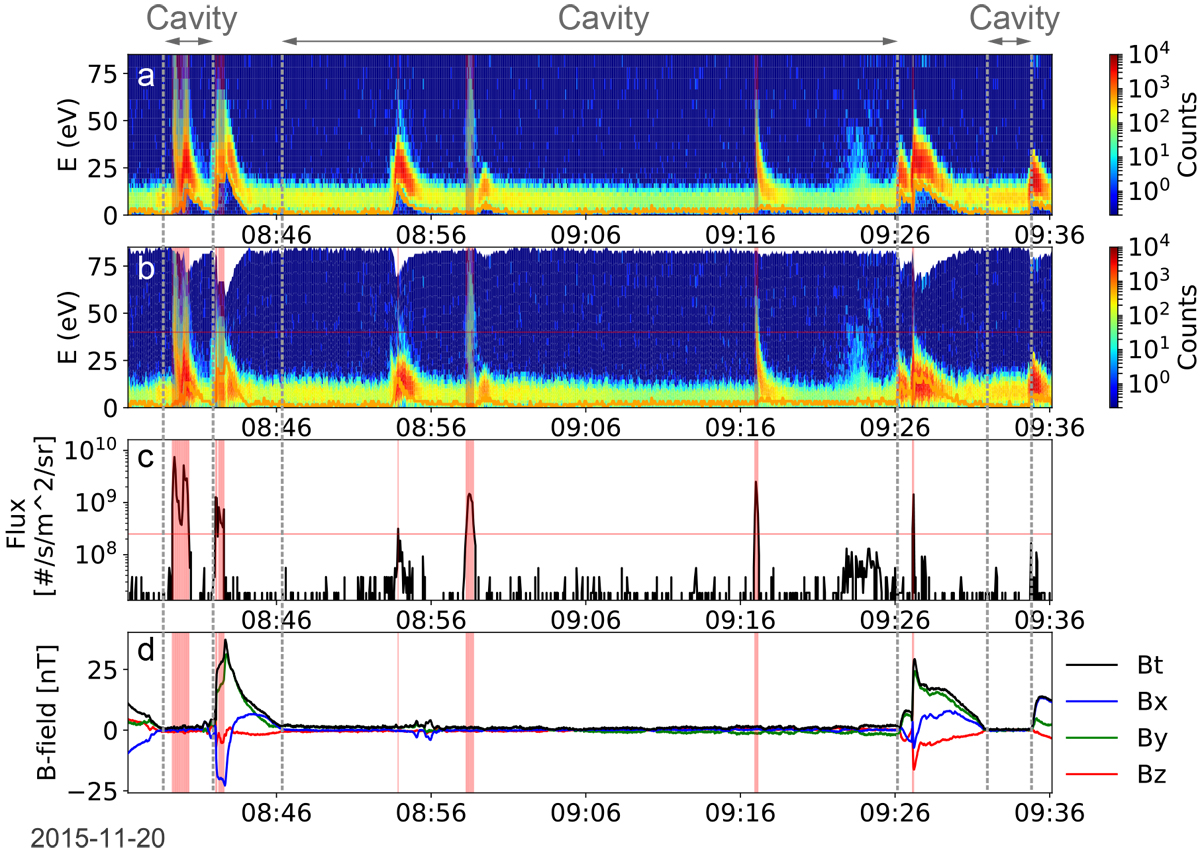
(a) original ion energy-time spectrum, (b) ion energy-time spectrum corrected for the spacecraft potential, (c) average ion fluxes (40–80 eV), and (d) magnetic field. The gray vertical dashed lines indicate the boundaries of the diamagnetic cavity. The red vertical lines indicate detections of accelerated ions at the respective time stamps per energy scan.
Current usage metrics show cumulative count of Article Views (full-text article views including HTML views, PDF and ePub downloads, according to the available data) and Abstracts Views on Vision4Press platform.
Data correspond to usage on the plateform after 2015. The current usage metrics is available 48-96 hours after online publication and is updated daily on week days.
Initial download of the metrics may take a while.