Fig. 2
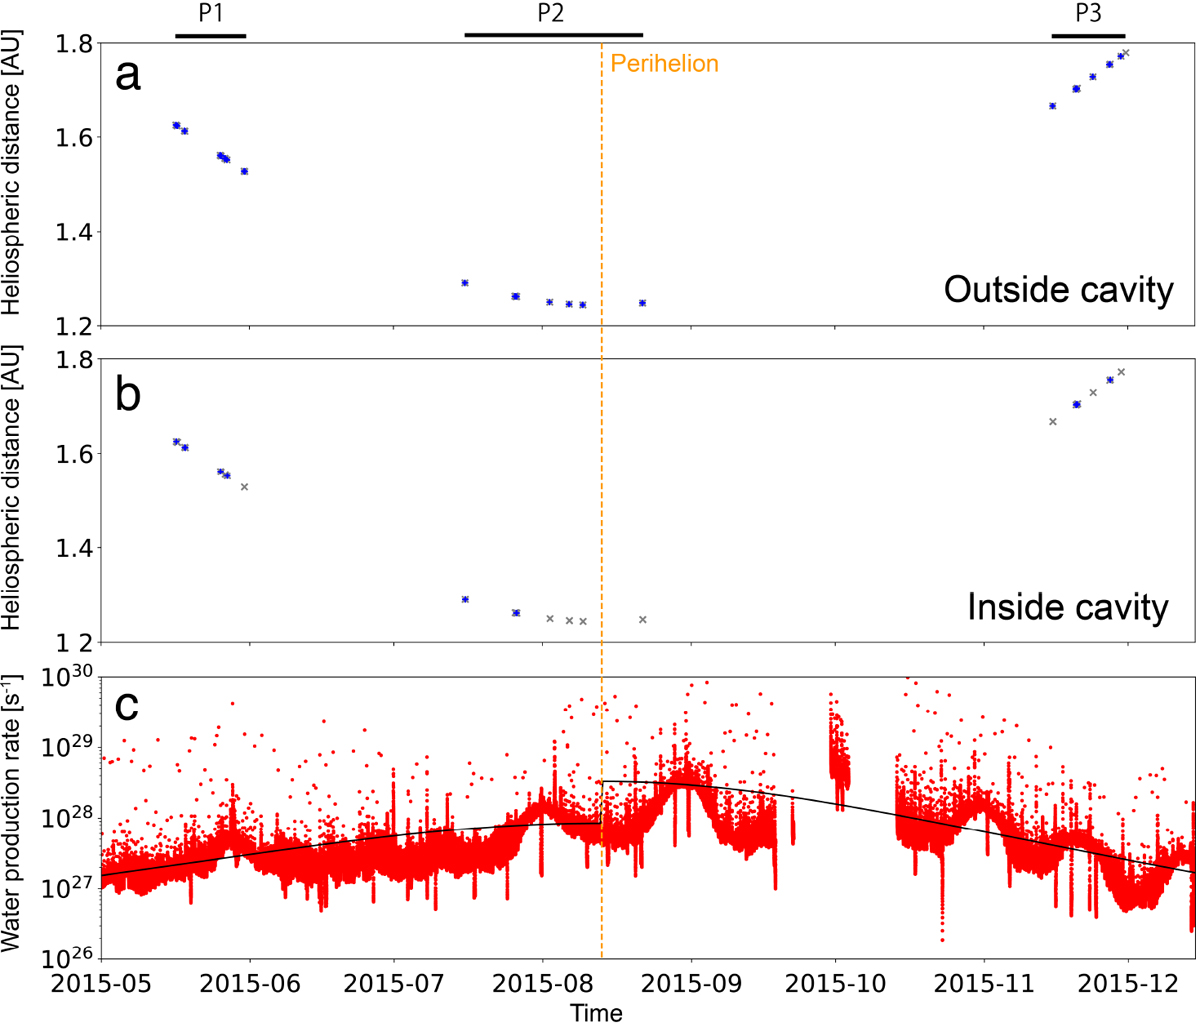
Time series of the heliospheric distance of 67P during which Rosetta was (a) just outside and (b) inside the cavity. The blue and gray markers indicate times when the accelerated ions were or were not observed. (c) Time series of the water production rate at 67P obtained from the Haser model using ROSINA/COPS observations (red dots) and the Hansen model (black). P1, P2, and P3 shown above the figure are three subperiods of our observation period.
Current usage metrics show cumulative count of Article Views (full-text article views including HTML views, PDF and ePub downloads, according to the available data) and Abstracts Views on Vision4Press platform.
Data correspond to usage on the plateform after 2015. The current usage metrics is available 48-96 hours after online publication and is updated daily on week days.
Initial download of the metrics may take a while.