Fig. 5
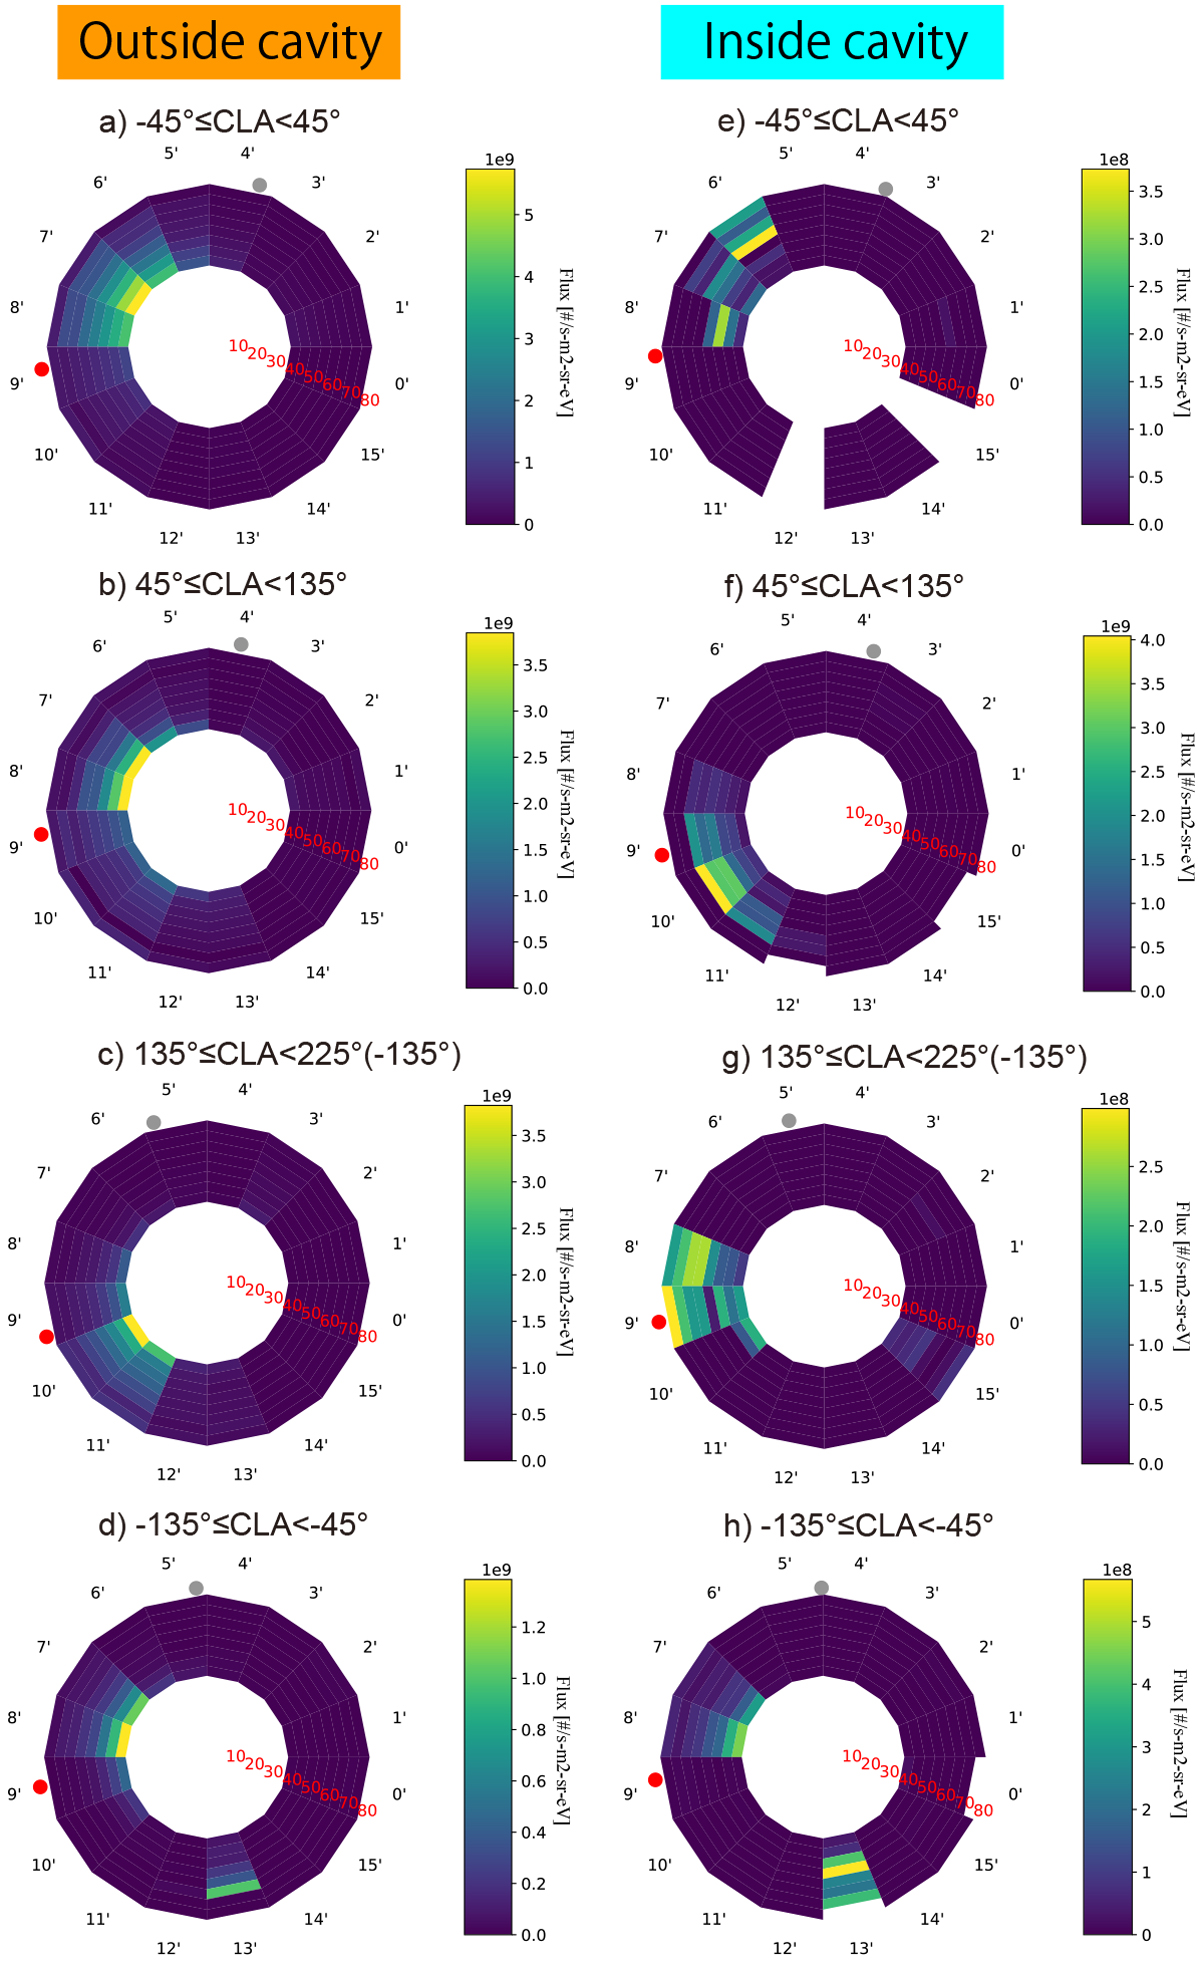
Average energy-sector flux distributions of the accelerated ions in the CSEQ frame. The plots in the left and right sides are based on observations outside and inside the cavity, respectively. The plots in each row show the different clock angles (CLA) of the Rosetta position in the YZ plane: (a and e) − 45° ≤ CLA ≤ 45°, (b and f) 45° ≤CLA ≤ 135°, (c and g) 135° ≤CLA ≤225° (− 135°), and (d and h) − 135° ≤CLA ≤−45°. The red numbers shown in the sector 0′ are energy, and the closed red and gray circles by the outer edge of the sector plane indicate the average Sun and comet directions in sector 9′ and sectors 3′, 4′, and 5′. White bins indicate no observation caused by unused sectors 0 and 13 of the original sector plane and/or by the energy correction for the cutoff energy.
Current usage metrics show cumulative count of Article Views (full-text article views including HTML views, PDF and ePub downloads, according to the available data) and Abstracts Views on Vision4Press platform.
Data correspond to usage on the plateform after 2015. The current usage metrics is available 48-96 hours after online publication and is updated daily on week days.
Initial download of the metrics may take a while.