Fig. 4.
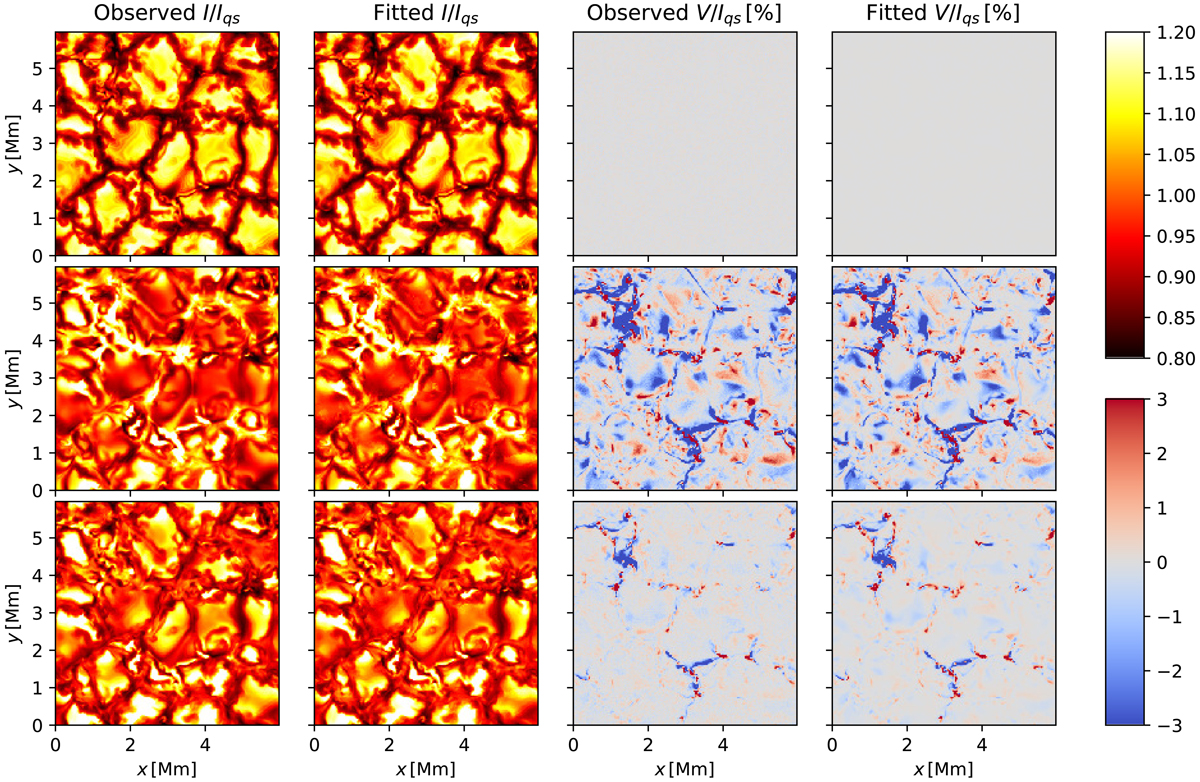
Observed (Cols. 1 and 3), and best fit (Cols. 2 and 4) images at wavelengths corresponding to the continuum (top), and the line centers of the two reddest IR spectral lines considered in this study. All five lines were inverted, but only the two reddest are shown. The inverted data is the version 1 data (convolved with spectra PSF and with noise added). Stokes V images correspond to wavelengths shifted by 100 mÅ to the red.
Current usage metrics show cumulative count of Article Views (full-text article views including HTML views, PDF and ePub downloads, according to the available data) and Abstracts Views on Vision4Press platform.
Data correspond to usage on the plateform after 2015. The current usage metrics is available 48-96 hours after online publication and is updated daily on week days.
Initial download of the metrics may take a while.