Fig. 1.
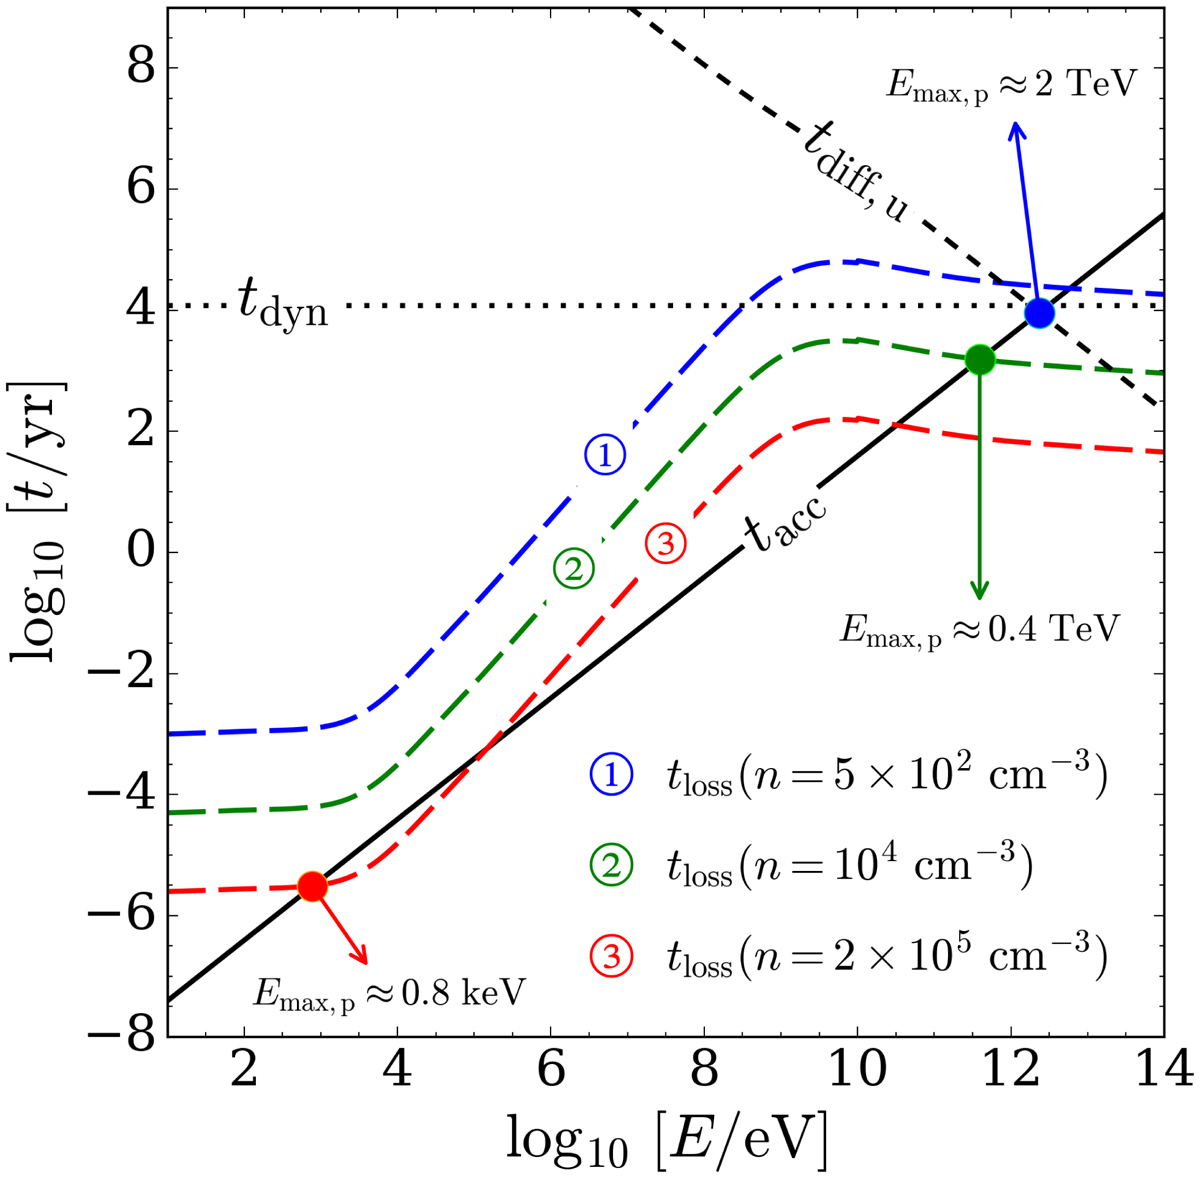
Acceleration timescale (tacc, solid black line), upstream diffusion timescale (tdiff, u, short-dashed black line), and dynamical timescale (tdyn, dotted black line) versus proton energy for T = 104 K, U = 40 km s−1, B = 100 μG, and R = 105 AU. The collisional loss timescale (tloss, long-dashed line plus colour-coding in the plot legend) depends on the density. The blue, green, and red dots show the value of the proton maximum energy for n = 5 × 102 cm−3, 104 cm−3, and 2 × 105 cm−3, respectively. We note that Emax, p is obtained by the intersection of tacc with tdiff, u for n = 5 × 102 cm−3, while for the other two cases at higher n by the intersection of tacc with tloss.
Current usage metrics show cumulative count of Article Views (full-text article views including HTML views, PDF and ePub downloads, according to the available data) and Abstracts Views on Vision4Press platform.
Data correspond to usage on the plateform after 2015. The current usage metrics is available 48-96 hours after online publication and is updated daily on week days.
Initial download of the metrics may take a while.