Fig. A.1.
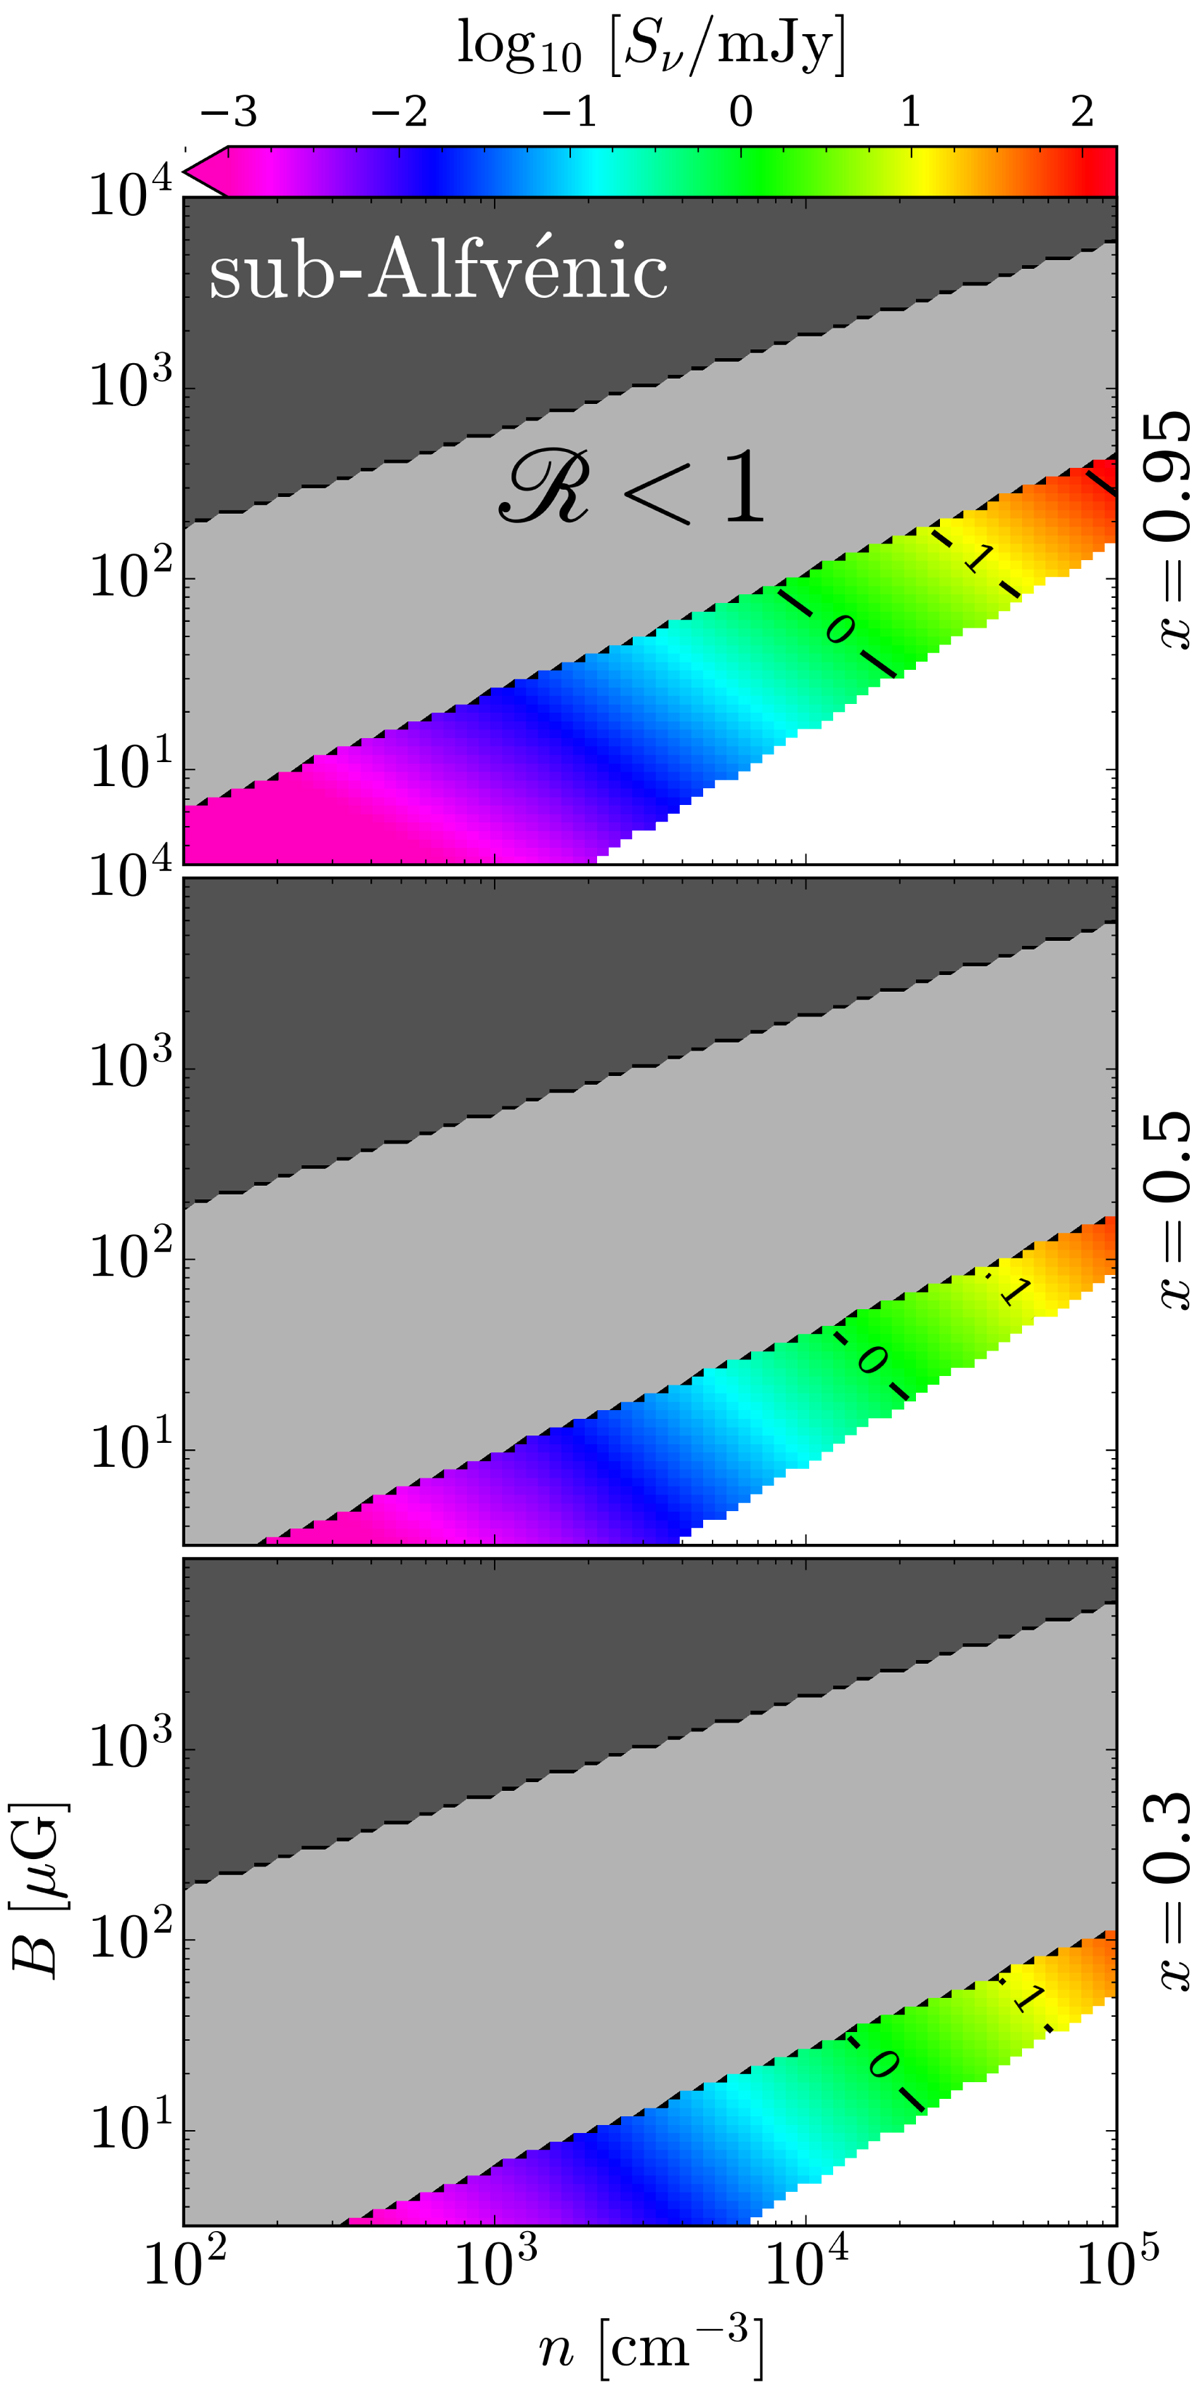
Flux density, Sν, for T = 7500 K, U = 40 km s−1, L = 0.5 pc, ν = 300 MHz, and θb = 10″ in parameter space (n, B) for three different values of ionisation fraction as labelled on right-hand side of each subplot. Dark and light grey-shaded areas in each subplot show the region of the parameter space where the condition of super-Alfvénic flow and ion-neutral coupling is not satisfied, respectively. Solid black lines in each subplot show the iso-flux density at 1 and 10 mJy in logarithmic scale (from the bottom up).
Current usage metrics show cumulative count of Article Views (full-text article views including HTML views, PDF and ePub downloads, according to the available data) and Abstracts Views on Vision4Press platform.
Data correspond to usage on the plateform after 2015. The current usage metrics is available 48-96 hours after online publication and is updated daily on week days.
Initial download of the metrics may take a while.