Fig. 2.
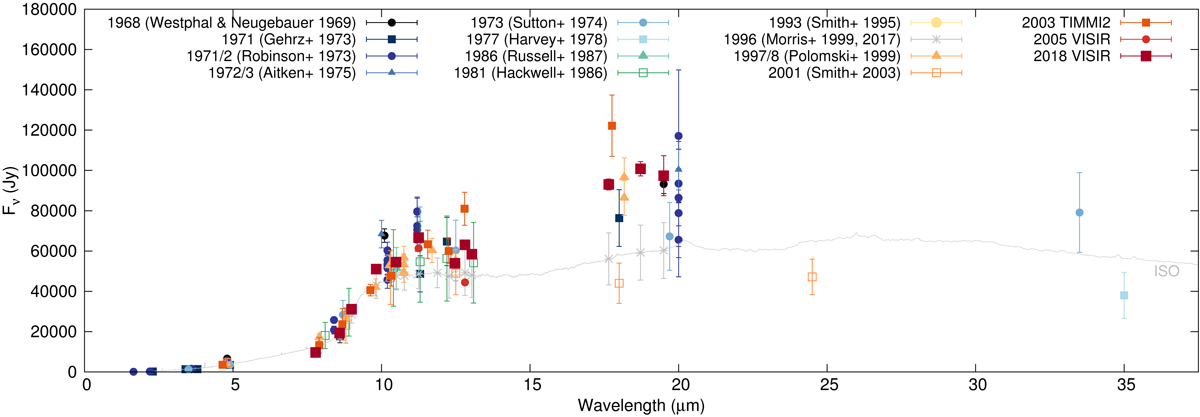
Mid-IR photometry of the integrated Homunculus nebula from 1968 to 2018. Colored symbols represent our new and historic mid-IR measurements performed in the 1960s (Westphal & Neugebauer 1969), 1970s (Gehrz et al. 1973; Robinson et al. 1973; Aitken & Jones 1975; Sutton et al. 1974; Harvey et al. 1978), 1980s (Hackwell et al. 1986; Russell et al. 1987), 1990s (Smith et al. 1995; Polomski et al. 1999; Morris et al. 1999, 2017), and 2000s (Smith et al. 2003). Calibration uncertainties may be larger than reported because of unaccounted for systematic uncertainties, sky variability, detector artifacts, and partial saturation. Open symbols represent values estimated from isophotal contour maps (Hackwell et al. 1986; Smith et al. 2003).
Current usage metrics show cumulative count of Article Views (full-text article views including HTML views, PDF and ePub downloads, according to the available data) and Abstracts Views on Vision4Press platform.
Data correspond to usage on the plateform after 2015. The current usage metrics is available 48-96 hours after online publication and is updated daily on week days.
Initial download of the metrics may take a while.