Fig. 4.
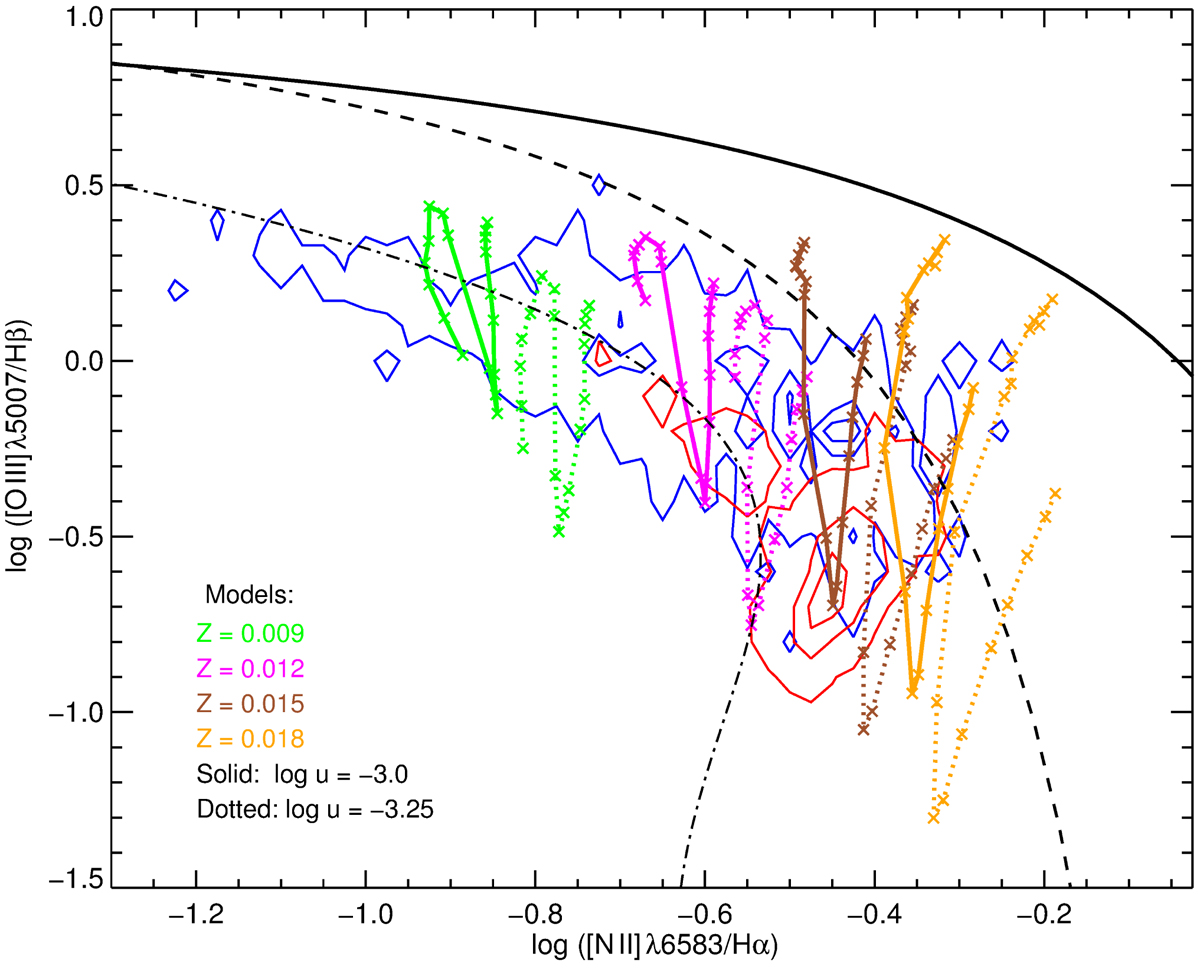
Diagnostic diagram representing [O III] λ5007/Hβ vs. [N II] λ6583/Hα. Observed inner (red) and outer (blue) H II regions distributions are represented with density contours. Photoionisation models predictions are overplotted: colours indicate different input metallicities, and solid and dotted lines indicate different input ionisation parameters, as showed in the plot legend. The solid and dotted black lines represent the Kewley et al. (2001) and Kauffmann et al. (2003) demarcation curves, respectively. The dash-dotted black line represents the fit made by Rousseau-Nepton et al. (2018) for NGC 628, as explained in the text.
Current usage metrics show cumulative count of Article Views (full-text article views including HTML views, PDF and ePub downloads, according to the available data) and Abstracts Views on Vision4Press platform.
Data correspond to usage on the plateform after 2015. The current usage metrics is available 48-96 hours after online publication and is updated daily on week days.
Initial download of the metrics may take a while.