Fig. 9.
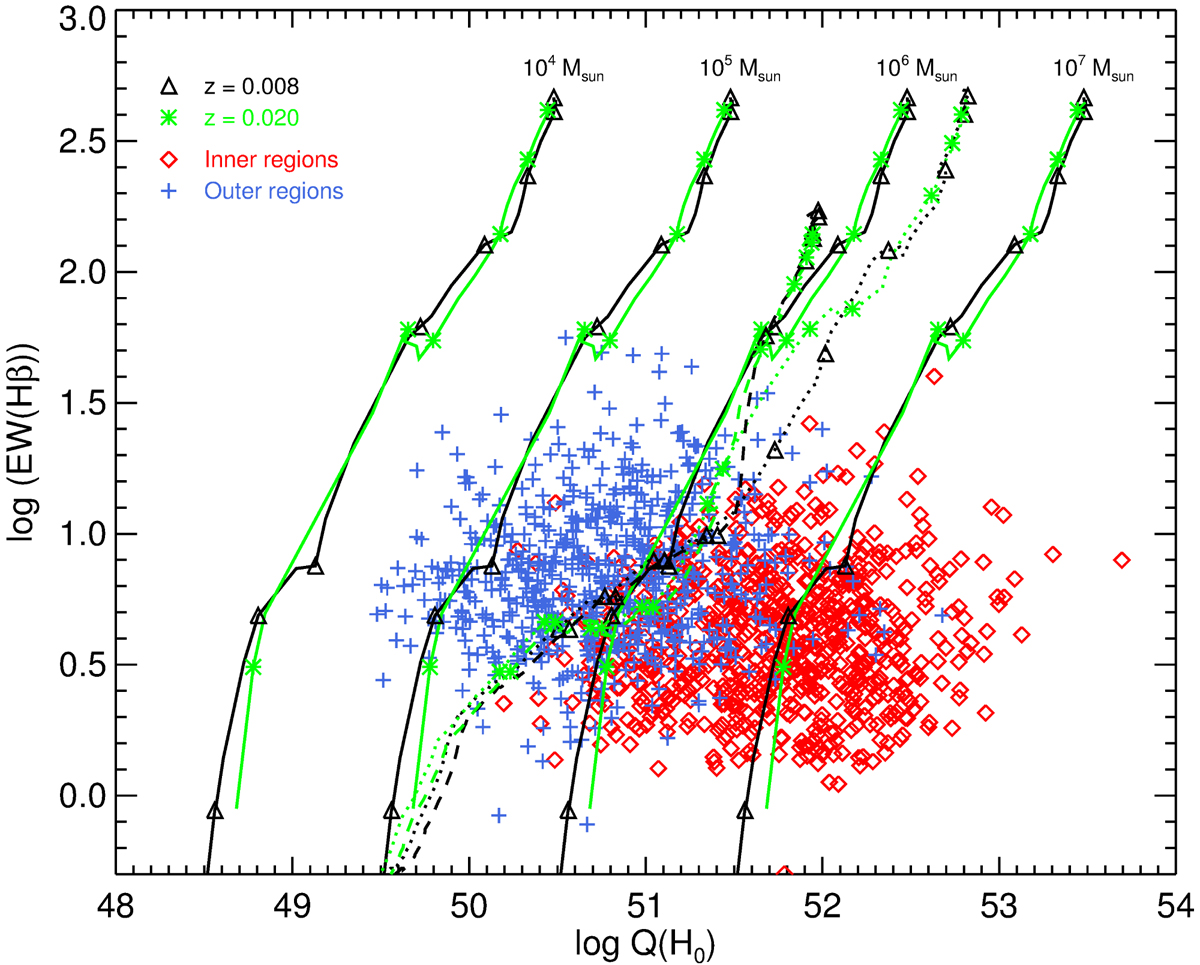
Diagram representing EW(Hβ) vs. Q(H0) for inner (red diamonds) and outer (blue crosses) observed H II regions. Overplotted solid lines are predictions by PopStar models for the evolution of EW(Hβ) and Q(H0) depending on age for two different metallicities: Z = 0.008 (black triangles) and Z = 0.02 (green asterisks) and four different ionising cluster masses, indicated in the plot in units of solar masses. Following the model prediction from top to down, each symbol indicates an evolution of 1 Myr, with a starting age of 1 Myr. Starburst99 model predictions are overplotted for the same metallicities using the same colour code, with dotted lines for Mup = 100 M⊙ and dashed lines for Mup = 30 M⊙.
Current usage metrics show cumulative count of Article Views (full-text article views including HTML views, PDF and ePub downloads, according to the available data) and Abstracts Views on Vision4Press platform.
Data correspond to usage on the plateform after 2015. The current usage metrics is available 48-96 hours after online publication and is updated daily on week days.
Initial download of the metrics may take a while.