Free Access
Fig. A.2
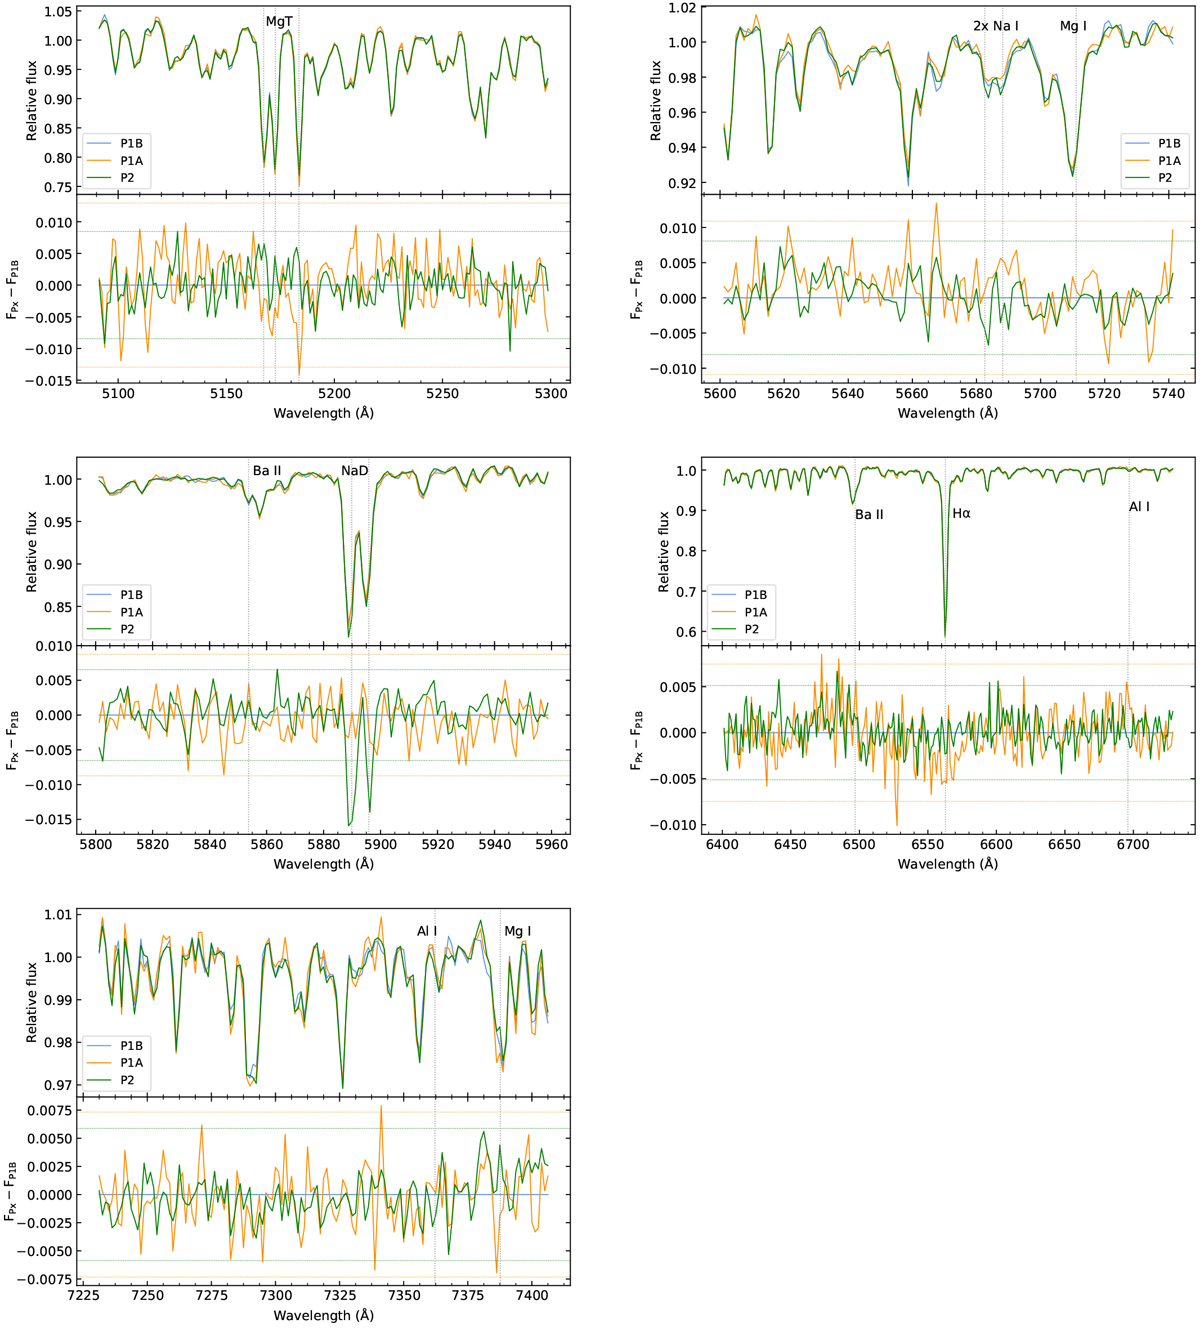
Comparisons between the spectra of the population A and B in NGC 2808. As a reference we also show the spectrum of P2. The residuals on the bottom panels are plotted as the difference between the flux of population 1A (or 2) and 1B (FPx – FP1B). The horizontal dotted lines represent the 3σ value of the residuals.
Current usage metrics show cumulative count of Article Views (full-text article views including HTML views, PDF and ePub downloads, according to the available data) and Abstracts Views on Vision4Press platform.
Data correspond to usage on the plateform after 2015. The current usage metrics is available 48-96 hours after online publication and is updated daily on week days.
Initial download of the metrics may take a while.