Free Access
Fig. 6
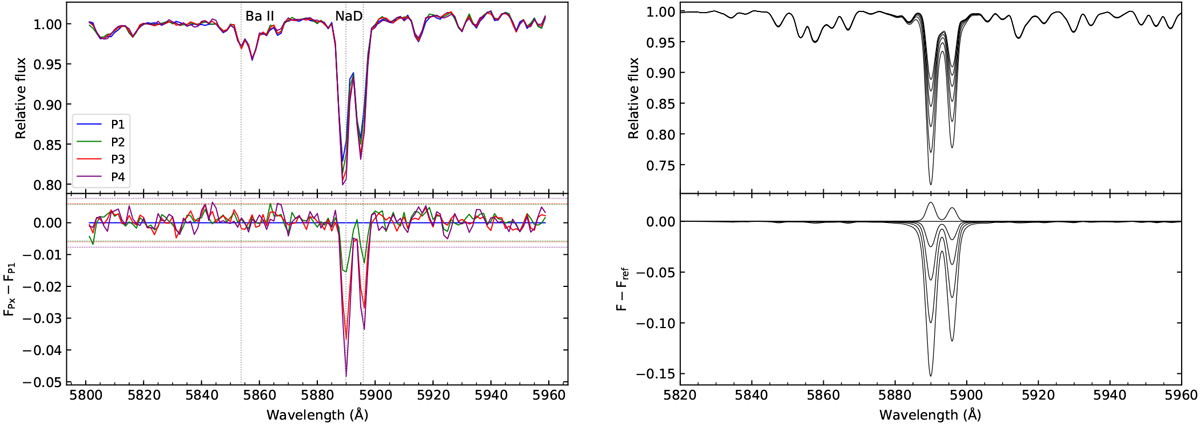
Left panel: same as Figs. 4 and 5 but for the NaD range. Right panel: NaD range in the synthetic spectra of P1 with [Na/M] varying from −0.25 to +1.00 bystep of 0.25 dex. The residuals at the bottom are plotted with respect to the spectrum having [Na/M] = 0.00, as assumed for the primordial population.
Current usage metrics show cumulative count of Article Views (full-text article views including HTML views, PDF and ePub downloads, according to the available data) and Abstracts Views on Vision4Press platform.
Data correspond to usage on the plateform after 2015. The current usage metrics is available 48-96 hours after online publication and is updated daily on week days.
Initial download of the metrics may take a while.