Fig. 8
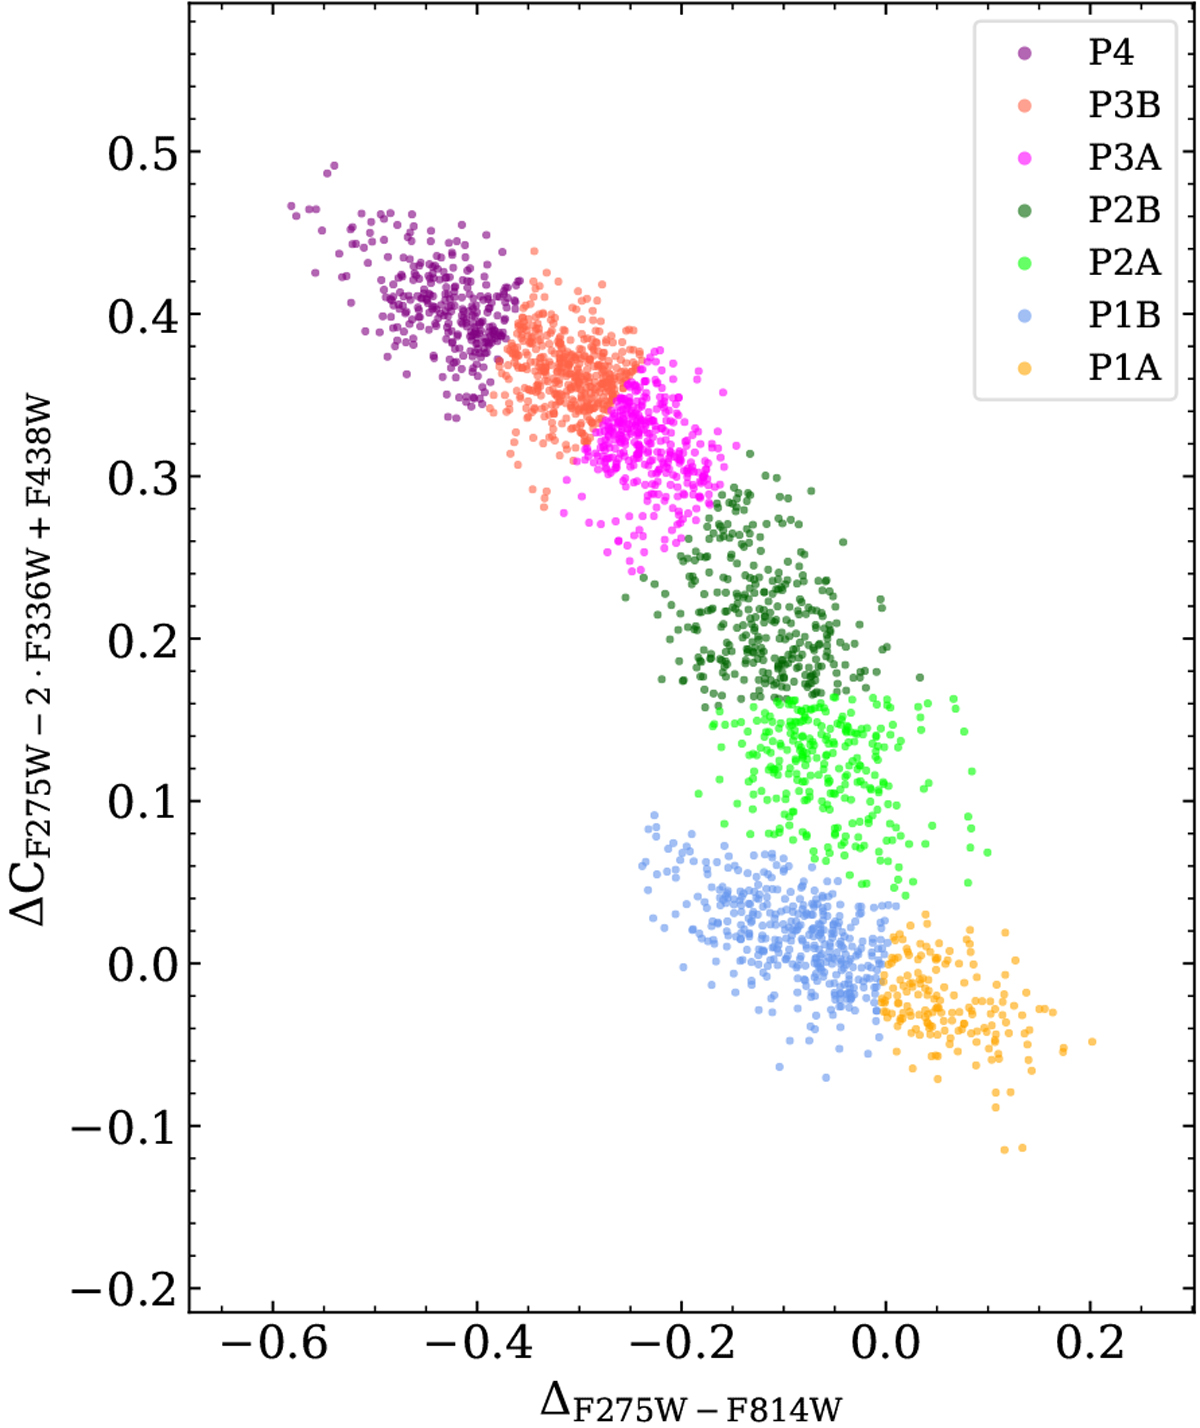
Chromosome map of NGC 2808 including additional subdivisions. The population 1 is divided in P1A and P1B following the nomenclature of Milone et al. (2015). Populations 2 and 3 are also each separated in two subgroups. The population groups are listed in the legend from the group on top of the chromosome map (P4) to that at the bottom (P1A).
Current usage metrics show cumulative count of Article Views (full-text article views including HTML views, PDF and ePub downloads, according to the available data) and Abstracts Views on Vision4Press platform.
Data correspond to usage on the plateform after 2015. The current usage metrics is available 48-96 hours after online publication and is updated daily on week days.
Initial download of the metrics may take a while.