Free Access
Fig. 9
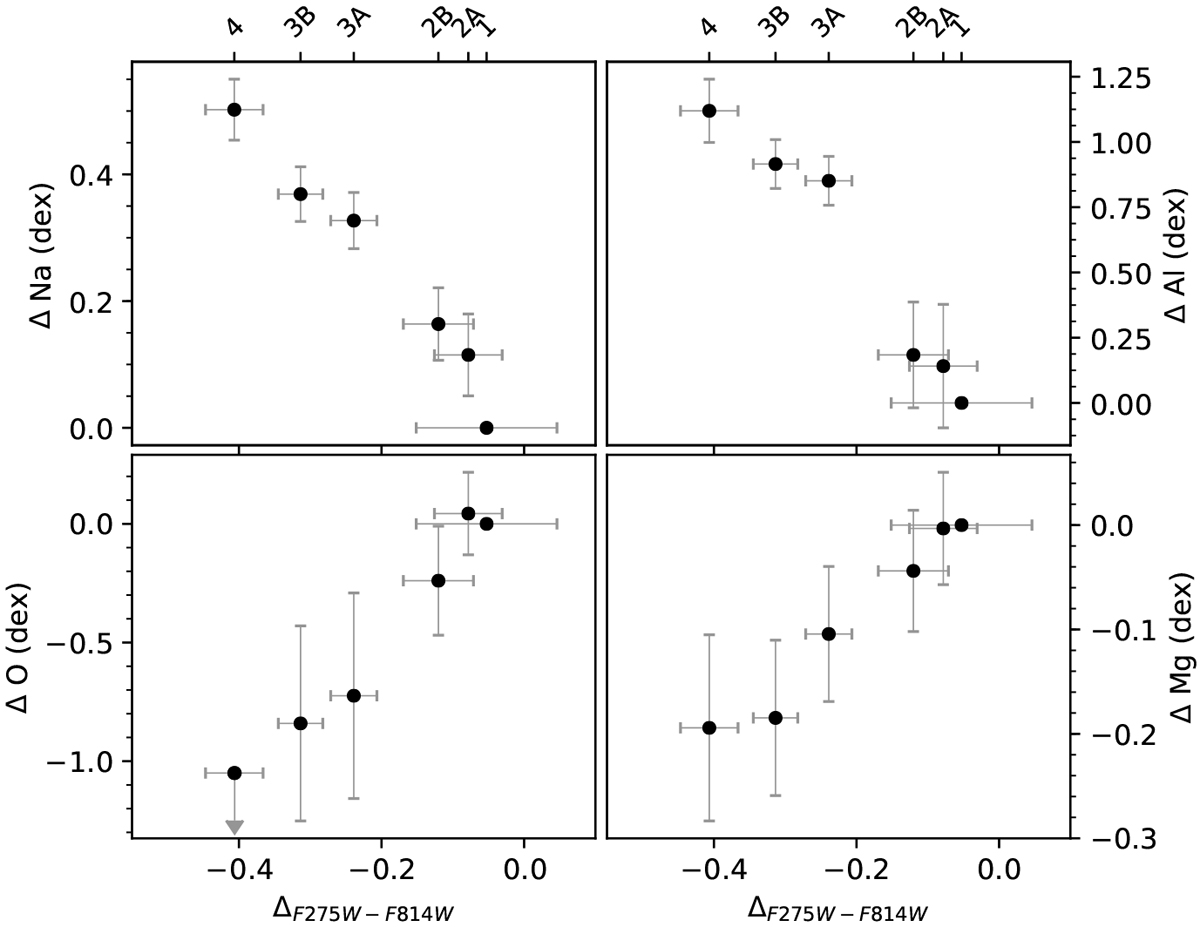
Abundance variations measured for O, Na, Mg and Al plotted against the median pseudo-color ΔF275W-F814W of the populations. The errors on the x-axis represent the 1σ dispersion in peusdo-color distribution of the given population. The population numbers are indicated on the top axes.
Current usage metrics show cumulative count of Article Views (full-text article views including HTML views, PDF and ePub downloads, according to the available data) and Abstracts Views on Vision4Press platform.
Data correspond to usage on the plateform after 2015. The current usage metrics is available 48-96 hours after online publication and is updated daily on week days.
Initial download of the metrics may take a while.