Fig. 7
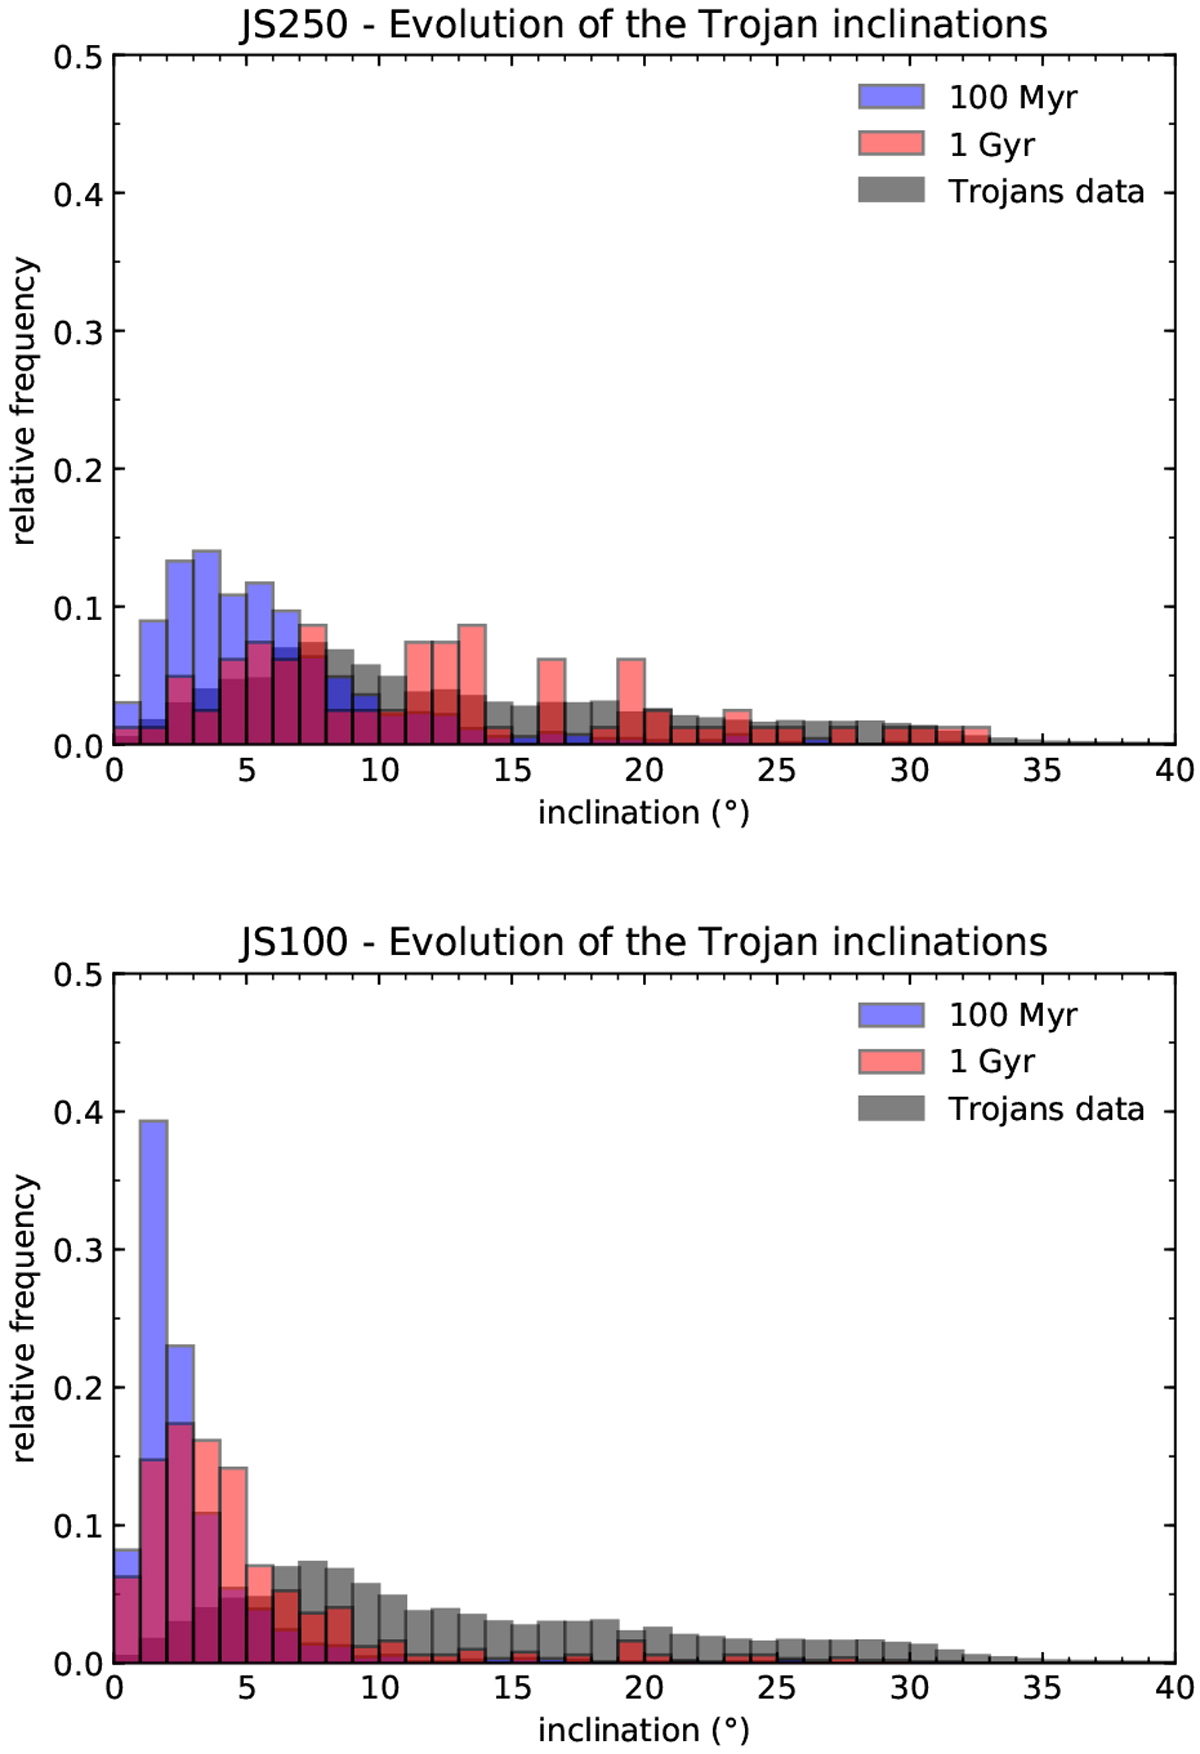
Inclination distribution of the Jupiter Trojans at t = 100 Myr (in blue) and t = 500 Myr (in red). In the top histogram we show the Trojan inclinations resulting from simulation JS250. In the bottom histogram we plot the Trojan inclinations resulting from simulation JS100. In grey we denote the current observed inclination distribution of the Trojans.
Current usage metrics show cumulative count of Article Views (full-text article views including HTML views, PDF and ePub downloads, according to the available data) and Abstracts Views on Vision4Press platform.
Data correspond to usage on the plateform after 2015. The current usage metrics is available 48-96 hours after online publication and is updated daily on week days.
Initial download of the metrics may take a while.