Fig. 1.
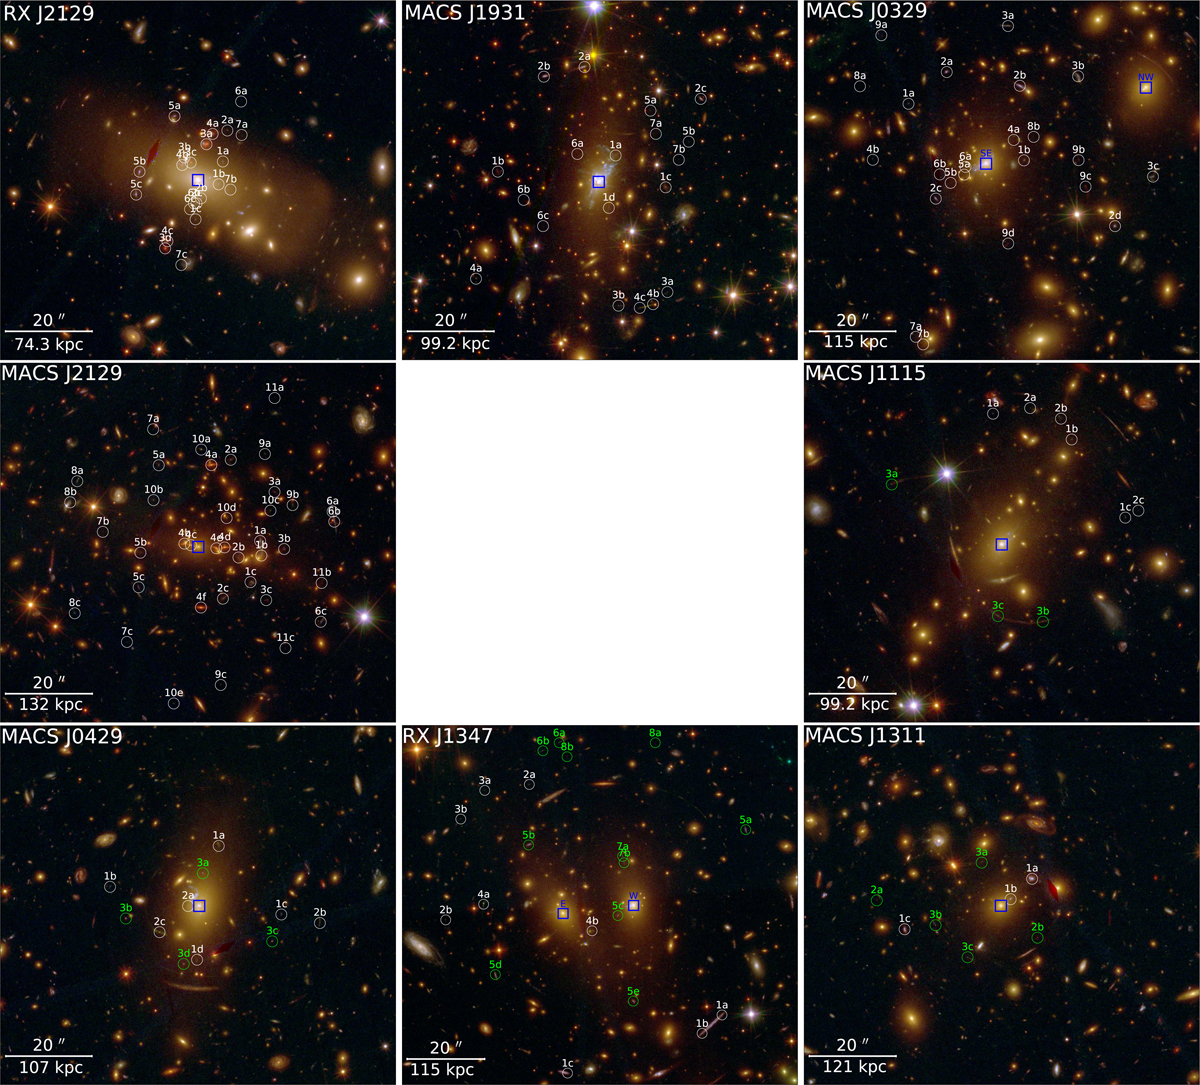
Colour composite images of the eight clusters in our sample created from the combination of the HST/ACS and WFC3 imaging. Circles show the multiple image positions used as model constraints in our strong lens modelling. We identify in white the families with spectroscopic redshift measurements and in green those for which the redshift value is a free parameter in our models (considered only in our silver sample, see Sect. 3 for more details). Blue boxes indicate the BCG positions.
Current usage metrics show cumulative count of Article Views (full-text article views including HTML views, PDF and ePub downloads, according to the available data) and Abstracts Views on Vision4Press platform.
Data correspond to usage on the plateform after 2015. The current usage metrics is available 48-96 hours after online publication and is updated daily on week days.
Initial download of the metrics may take a while.