Fig. 2.
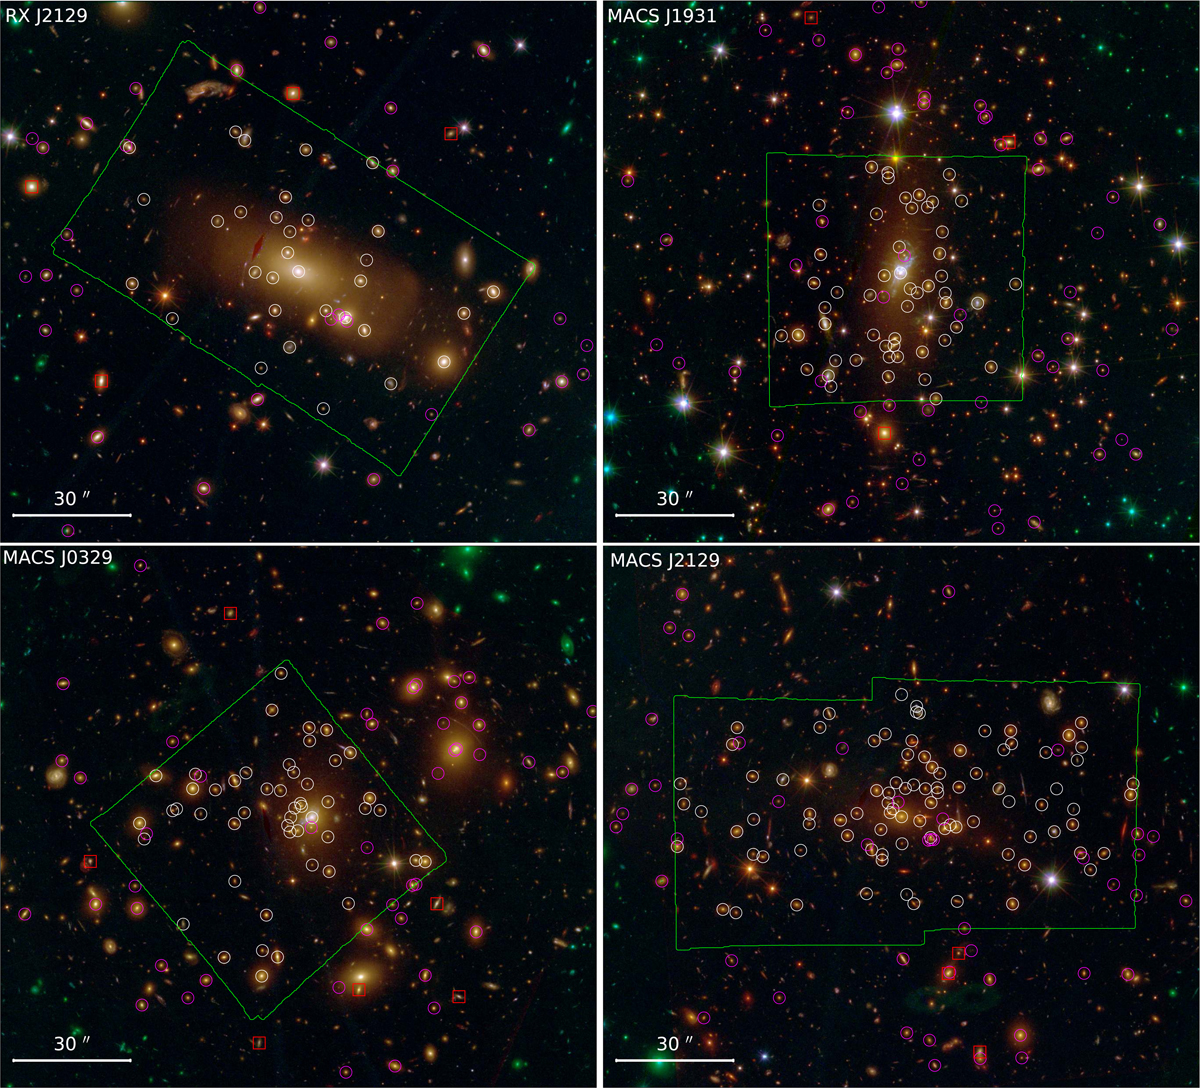
Cluster member selection. White and magenta circles show the position of the cluster members with MUSE spectroscopic confirmation and selected from photometry, respectively. Red boxes show the cluster members spectroscopically confirmed by CLASH-VLT and thus included in the final member catalogue, but not selected by our criteria. The green regions show the area covered by the MUSE observations.
Current usage metrics show cumulative count of Article Views (full-text article views including HTML views, PDF and ePub downloads, according to the available data) and Abstracts Views on Vision4Press platform.
Data correspond to usage on the plateform after 2015. The current usage metrics is available 48-96 hours after online publication and is updated daily on week days.
Initial download of the metrics may take a while.