Fig. 6.
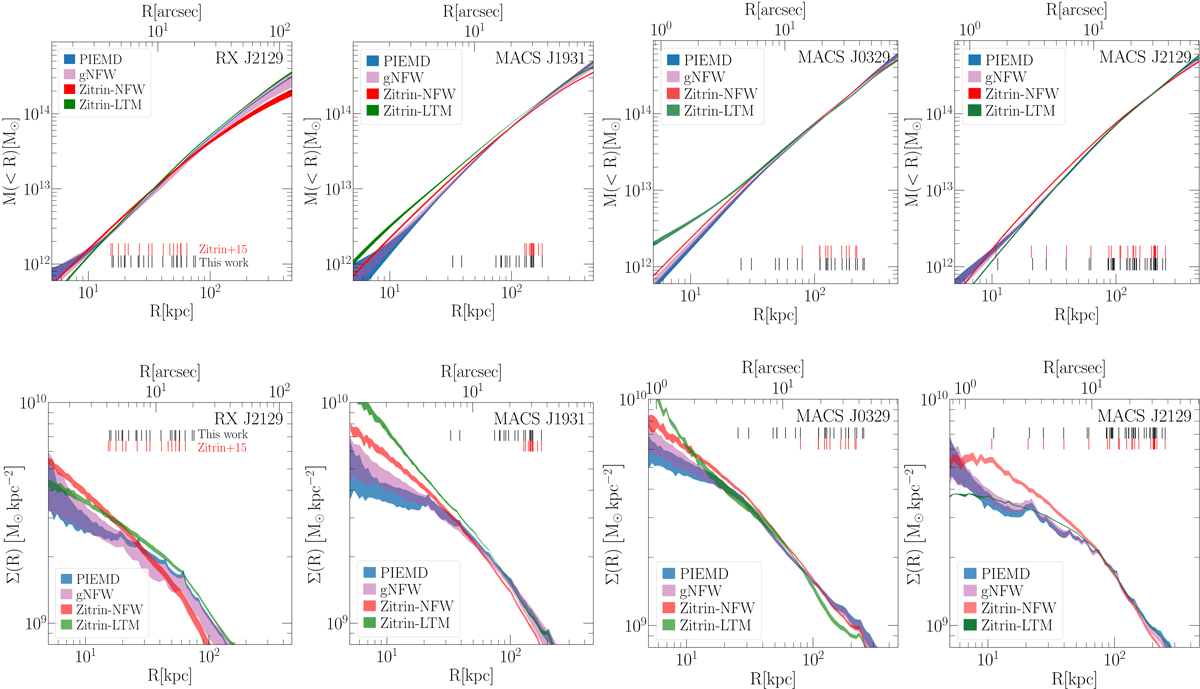
Top row: cumulative projected total mass profile out to R = 470 kpc from our reference lensing models using the PIEMD (blue) and gNFW (magenta) profiles for the main smooth mass component. Red and green regions show the models from Zitrin et al. (2015) with the two parametrizations NFW and LTM, respectively. Bottom row: same for the total surface mass density profile. The areas correspond to the 95% confidence level regions from 1000 random realizations of our models and 100 for the NFW and LTM models. Vertical lines indicate the distances from the BCG of the multiple images used to constraint the cluster total mass model in this work (black) and in Zitrin et al. (2015) (red, mainly with no spectroscopic measurements). The position of the centre used to compute the profiles in each realization is given by the centre of mass estimated within a circle of 10″ radius from the BCG. We remark that the external smooth components of MACS J1931 and MACS J2129 do not affect the total mass distributions over the radial distances considered here.
Current usage metrics show cumulative count of Article Views (full-text article views including HTML views, PDF and ePub downloads, according to the available data) and Abstracts Views on Vision4Press platform.
Data correspond to usage on the plateform after 2015. The current usage metrics is available 48-96 hours after online publication and is updated daily on week days.
Initial download of the metrics may take a while.