Fig. A.1.
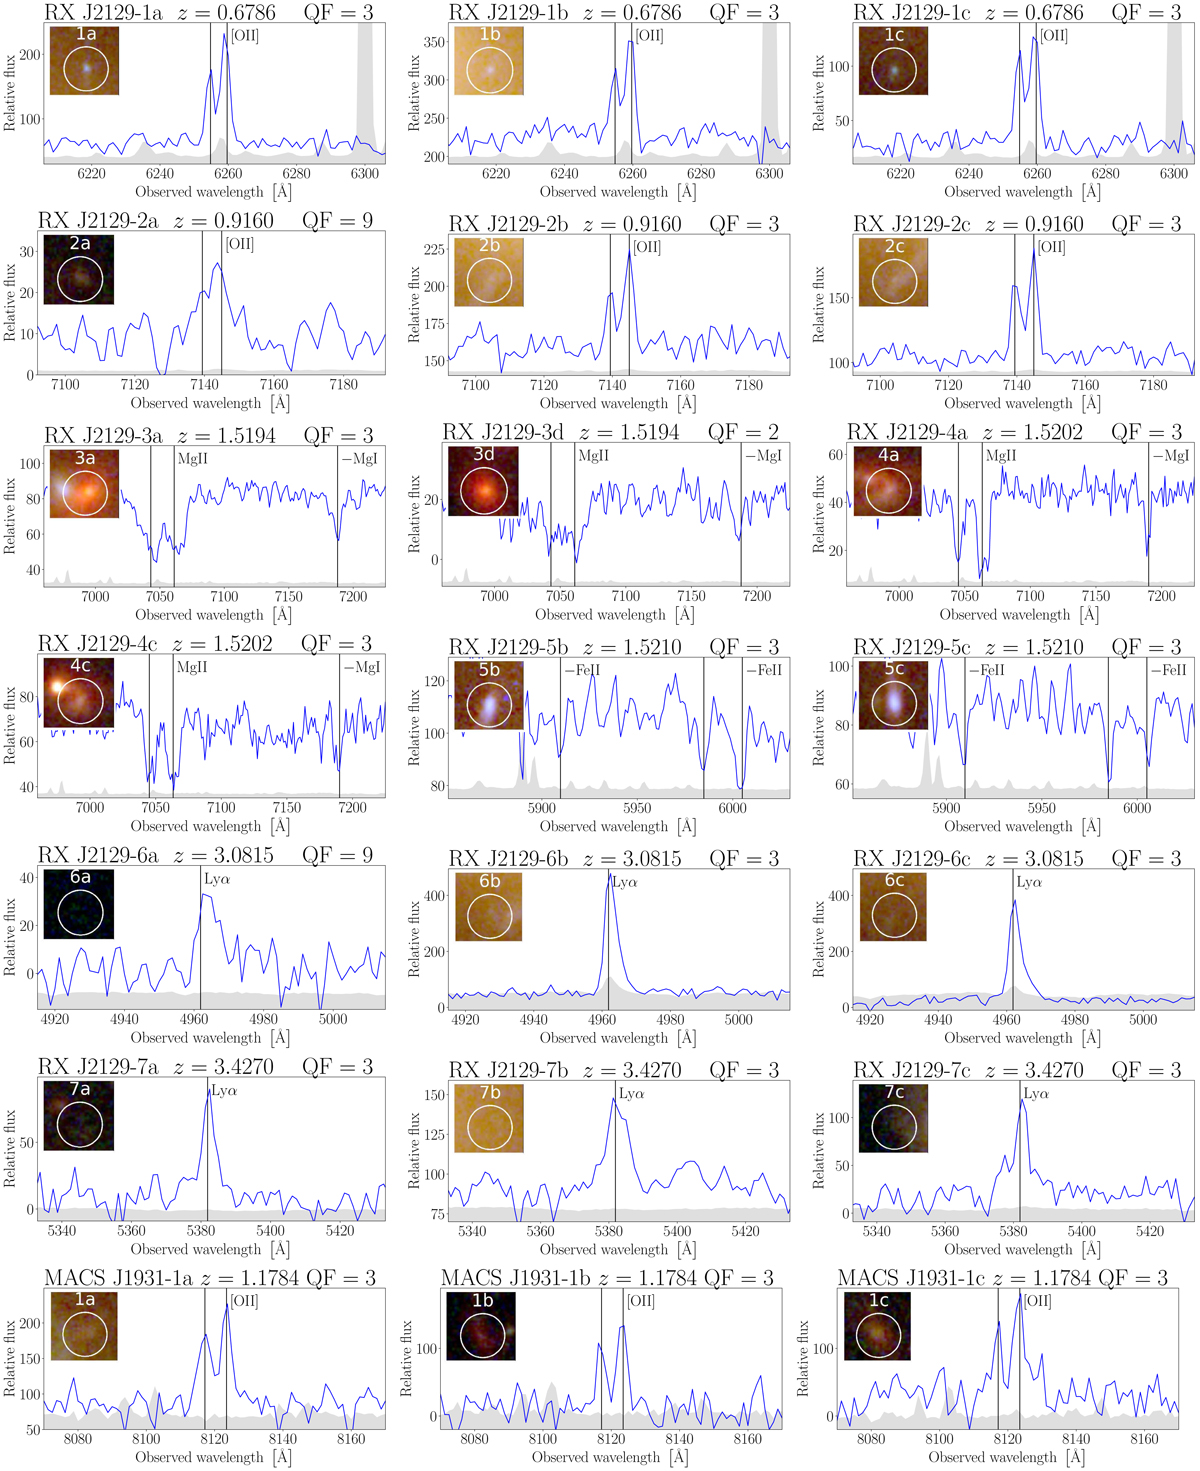
MUSE spectra of multiply lensed background sources. Vertical black lines indicate the positions of spectral features used to estimate the redshifts. The grey area shows the rescaled variance obtained from the data reduction pipeline; the flux is given in units of 10−20 erg s−1 cm−2 Å−1. The image boxes are extracted from the CLASH colour images and have 2″ side. The white circles show the HST counterparts and, for the cases with no apparent photometric counterparts, they are centred at the position of the MUSE peak emission. We remark that multiple image MACS J0329-9c has an independent redshift measurement from Vanzella et al. (in prep.).
Current usage metrics show cumulative count of Article Views (full-text article views including HTML views, PDF and ePub downloads, according to the available data) and Abstracts Views on Vision4Press platform.
Data correspond to usage on the plateform after 2015. The current usage metrics is available 48-96 hours after online publication and is updated daily on week days.
Initial download of the metrics may take a while.