Fig. 9.
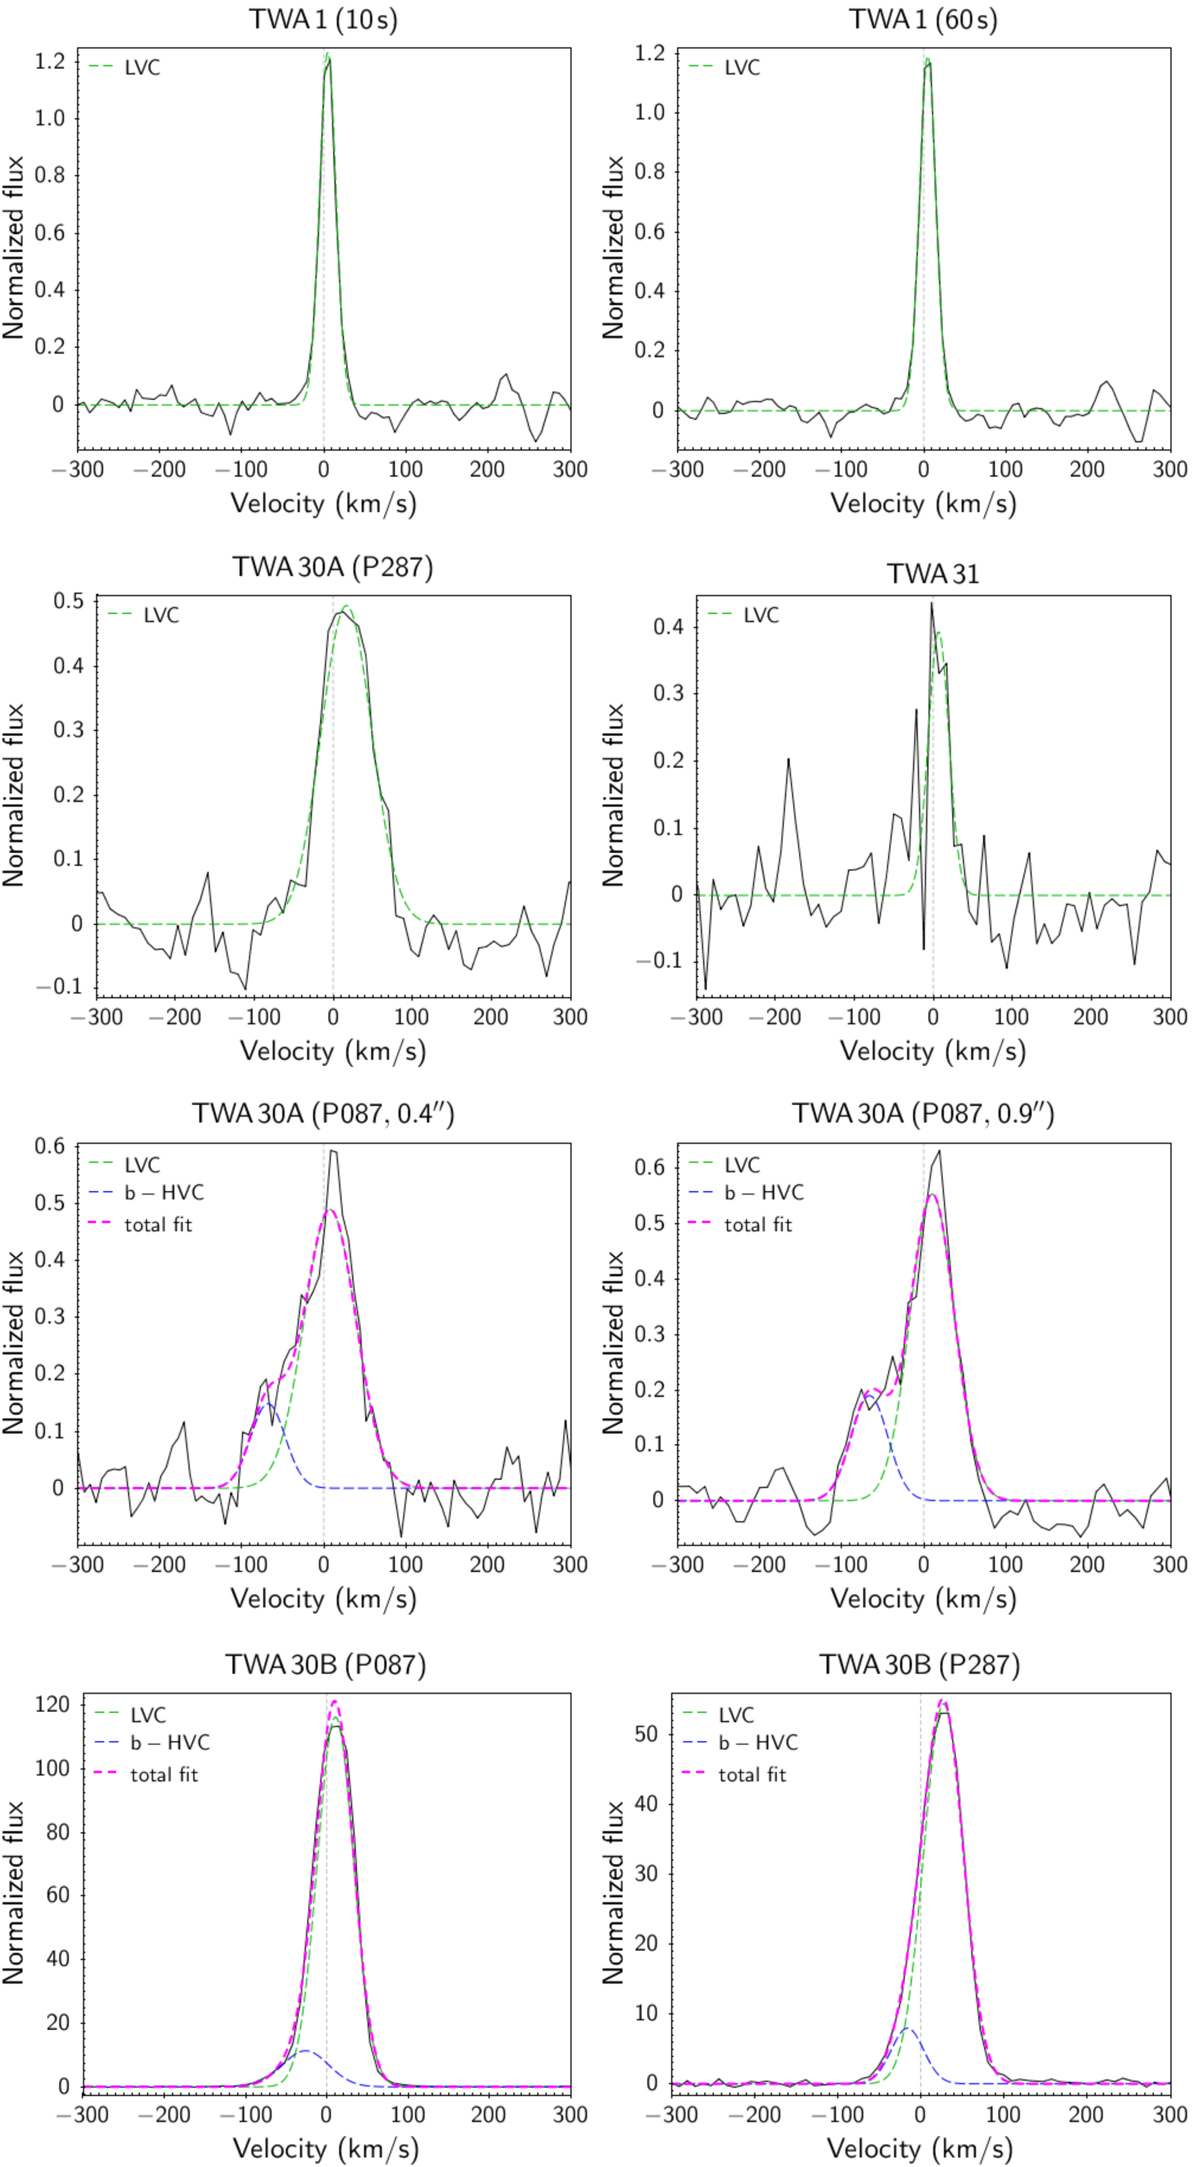
Best single-Gaussian (LVC) or double-Gaussian (LVC+HVC) solution obtained for the [O I] 6300 Å line profile decomposition of TWA 1, TWA30 A, TWA 30B, and TWA 31. The LVC is traced with a dotted green line, the blueshifted HVC (when present) is traced as a dotted blue line, and the total fit is traced as a dotted magenta line.
Current usage metrics show cumulative count of Article Views (full-text article views including HTML views, PDF and ePub downloads, according to the available data) and Abstracts Views on Vision4Press platform.
Data correspond to usage on the plateform after 2015. The current usage metrics is available 48-96 hours after online publication and is updated daily on week days.
Initial download of the metrics may take a while.