Fig. 5
Left panel: ![]() vs. the
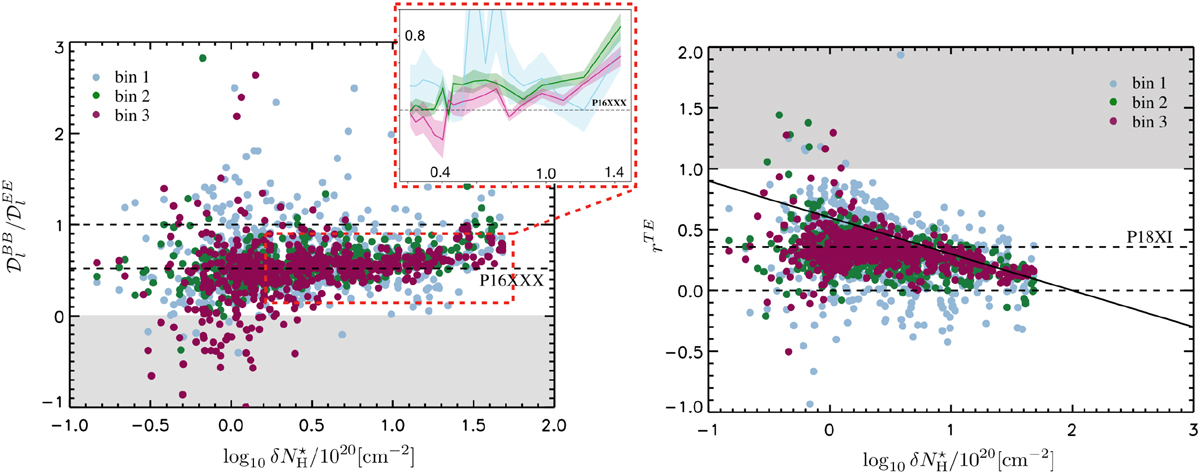
vs. the ![]() for all 552 circular regions in bin 1 (light blue), 2 (green), and 3 (purple). Horizontal dashed lines show: (i) the value of 1, corresponding to equal power in E and B modes; (ii)the value of 0.52, as reported in P16XXX. The inset shows the mean and standard deviation of
for all 552 circular regions in bin 1 (light blue), 2 (green), and 3 (purple). Horizontal dashed lines show: (i) the value of 1, corresponding to equal power in E and B modes; (ii)the value of 0.52, as reported in P16XXX. The inset shows the mean and standard deviation of ![]() for all multipole bins to highlight the increase of the ratio at high column density. The mean values are computed in bins of
for all multipole bins to highlight the increase of the ratio at high column density. The mean values are computed in bins of ![]() that contain 20 data points each. Right panel: scatter plot of
that contain 20 data points each. Right panel: scatter plot of ![]() vs.
vs. ![]() . Colors are same as in the left panel. Horizontal dashed lines show: (i) the value of 0, corresponding to absence of correlation between intensity and E modes; (ii) the value of 0.36, as reported in P18XI. The solid line shows a fit of
. Colors are same as in the left panel. Horizontal dashed lines show: (i) the value of 0, corresponding to absence of correlation between intensity and E modes; (ii) the value of 0.36, as reported in P18XI. The solid line shows a fit of ![]() for
for ![]() . The gray-shaded areas in both panels refer to regions dominated by instrumental noise and data systematic effects.
. The gray-shaded areas in both panels refer to regions dominated by instrumental noise and data systematic effects.
Current usage metrics show cumulative count of Article Views (full-text article views including HTML views, PDF and ePub downloads, according to the available data) and Abstracts Views on Vision4Press platform.
Data correspond to usage on the plateform after 2015. The current usage metrics is available 48-96 hours after online publication and is updated daily on week days.
Initial download of the metrics may take a while.