Fig. 1.
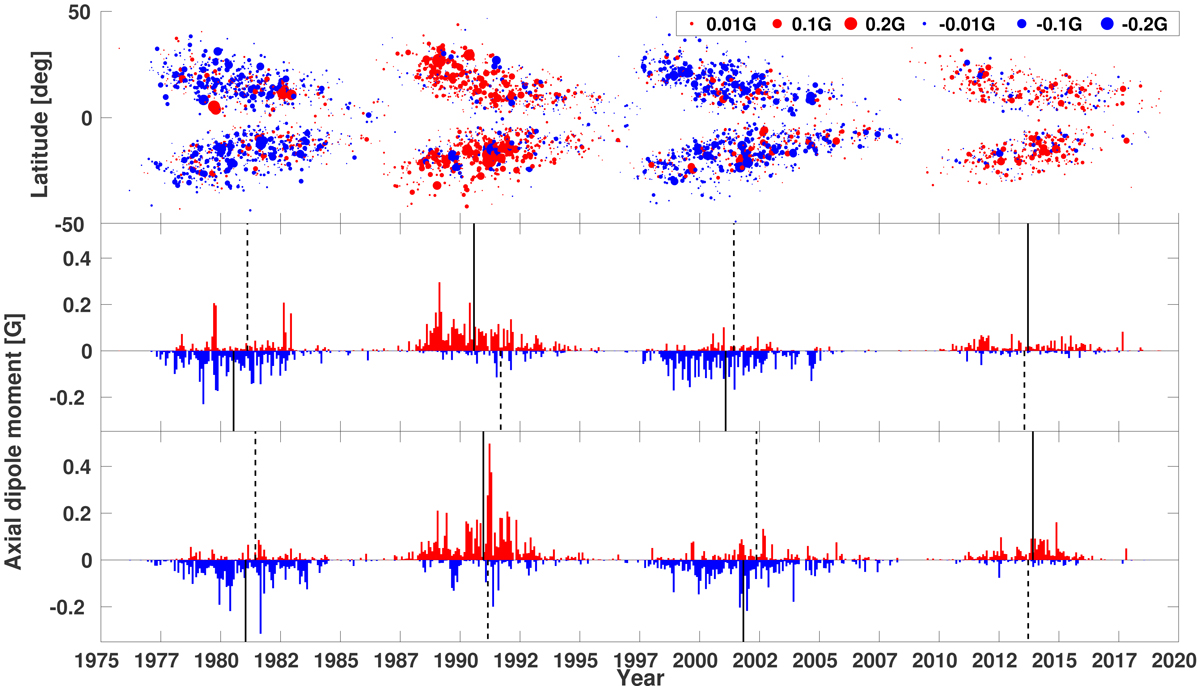
Top panel: scatter plot of axial dipole moments of all active regions of cycles 21−24. The areas of the circles are proportional to the axial dipole moments of the active regions, and red and blue colors represent positive and negative axial dipole moments, respectively. Middle panel: rotational sums of negative and positive axial dipole moments for northern hemisphere. Bottom panel: rotational sums of negative and positive axial dipole moments for southern hemisphere. Vertical lines are axial dipole moment-weighted average emergence times of wings. Solid line is for the normal sign, dashed line for the opposite sign.
Current usage metrics show cumulative count of Article Views (full-text article views including HTML views, PDF and ePub downloads, according to the available data) and Abstracts Views on Vision4Press platform.
Data correspond to usage on the plateform after 2015. The current usage metrics is available 48-96 hours after online publication and is updated daily on week days.
Initial download of the metrics may take a while.