Fig. A.1
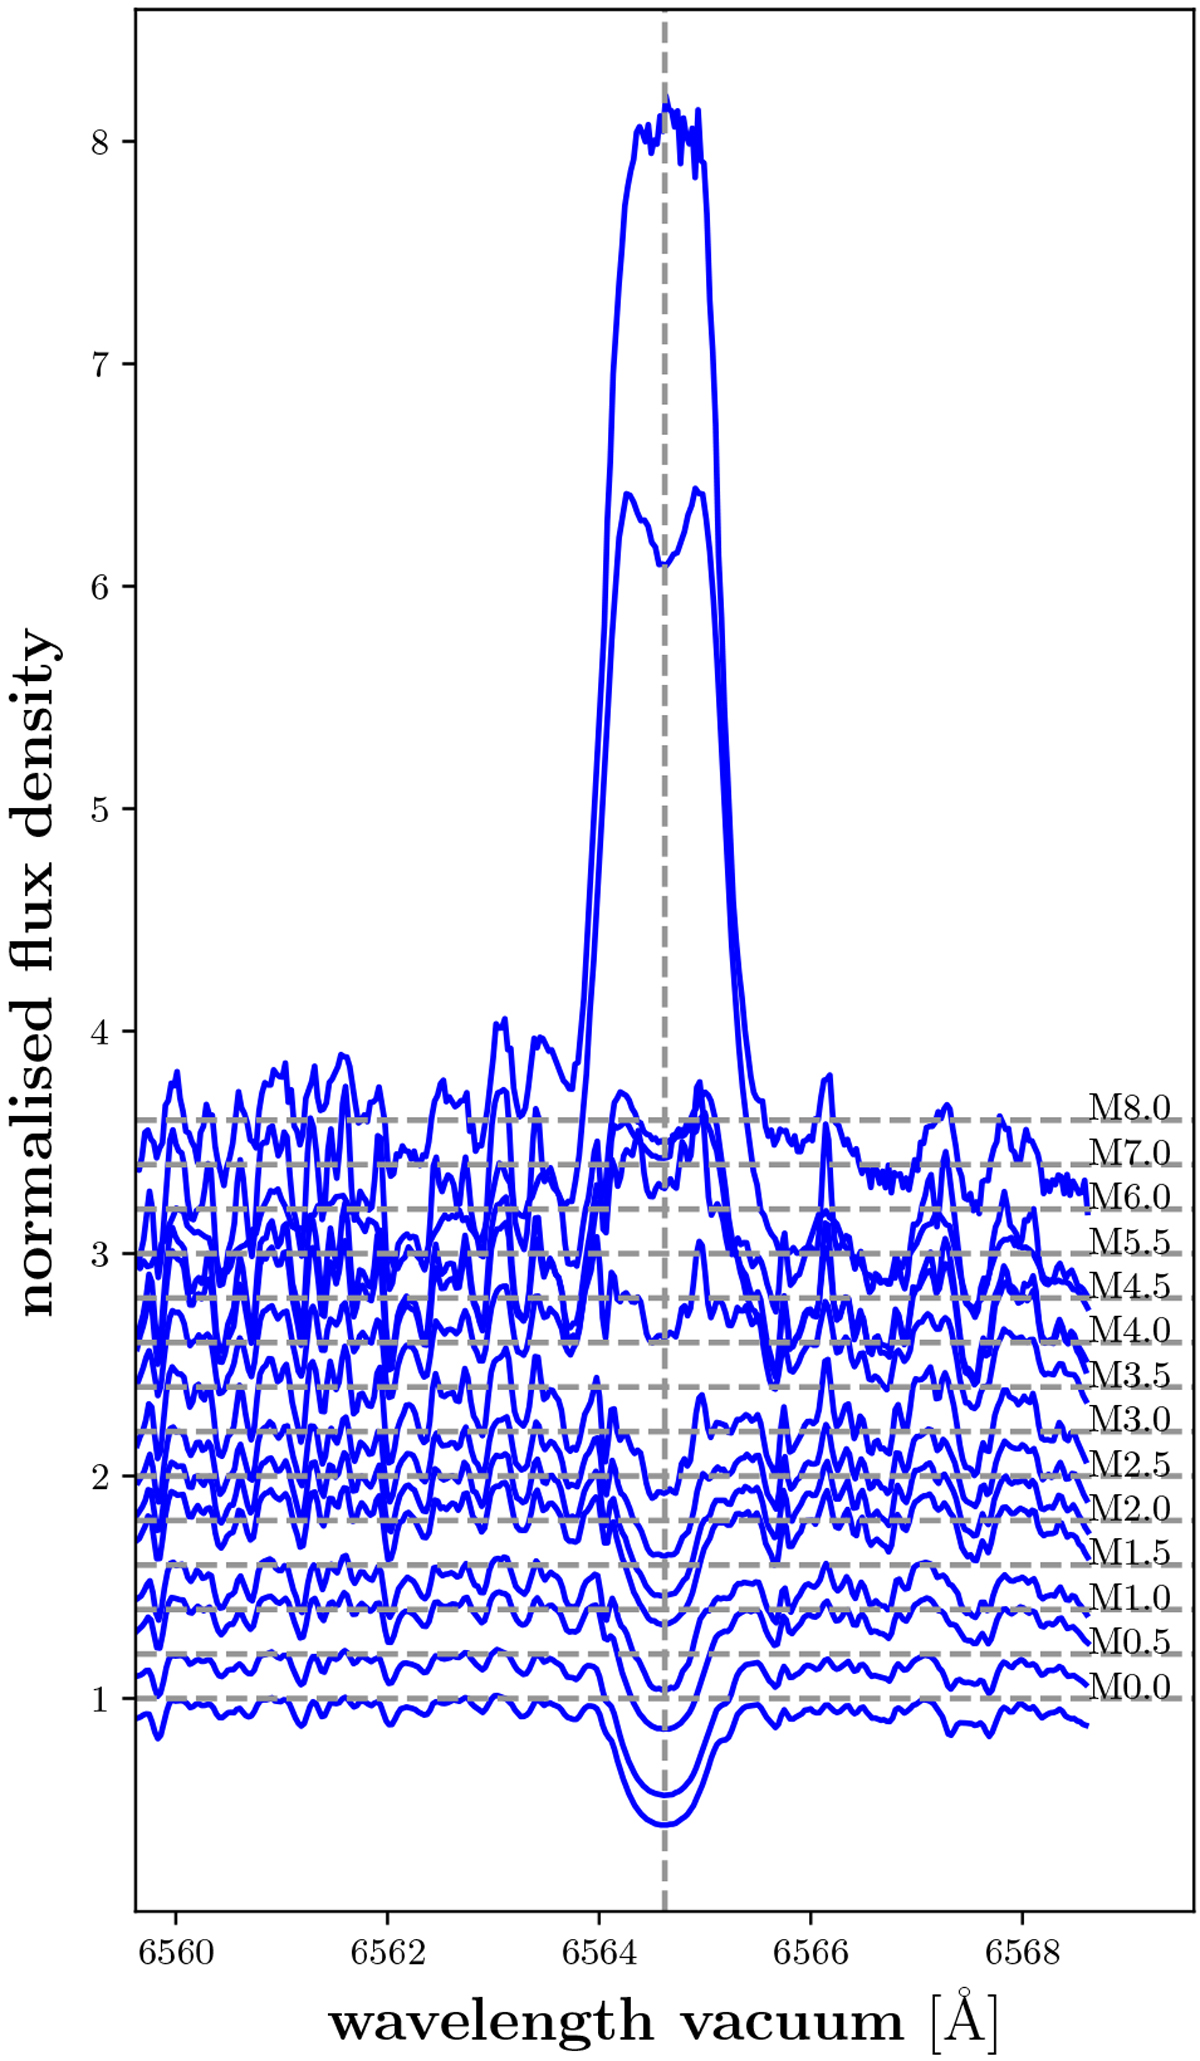
Spectral-type series for region around Hα. Each normalised spectrum (blue line) is offset by 0.2 in flux density for clarity purposes. The continuumfor each spectrum is marked with a dashed grey line. The position of the line centre is marked with a grey dashed vertical line. While early M dwarfs are typically inactive (showing Hα in absorption), mid- to late-type M dwarfs are typically active, with very variable Hα emission. The shown stars are (same as in Fig. 2): M0.0 V: J03463+262/HD 23453. M0.5 V: J02222+478/BD+ 47 612. M1.0 V: J00051+457/GJ 2. M1.5 V: J02123+035/BD+02 348. M2.0 V: J01013+613/GJ 47. M2.5 V: J00389+306/Wolf 1056. M3.0 V: J02015+637/G 244-047. M3.5 V: J12479+097/Wolf 437. M4.0 V: J01339-176/LP 768-113. M4.5 V: J01125-169/YZ Cet. M5.5 V: J00067-075/GJ 1002. M6.0 V: J14321+081/LP 560-035 M7.0 V: J02530+ 168/Teegarden’s star. M8.0 V: J19169+051S/vB10.
Current usage metrics show cumulative count of Article Views (full-text article views including HTML views, PDF and ePub downloads, according to the available data) and Abstracts Views on Vision4Press platform.
Data correspond to usage on the plateform after 2015. The current usage metrics is available 48-96 hours after online publication and is updated daily on week days.
Initial download of the metrics may take a while.