Fig. 1
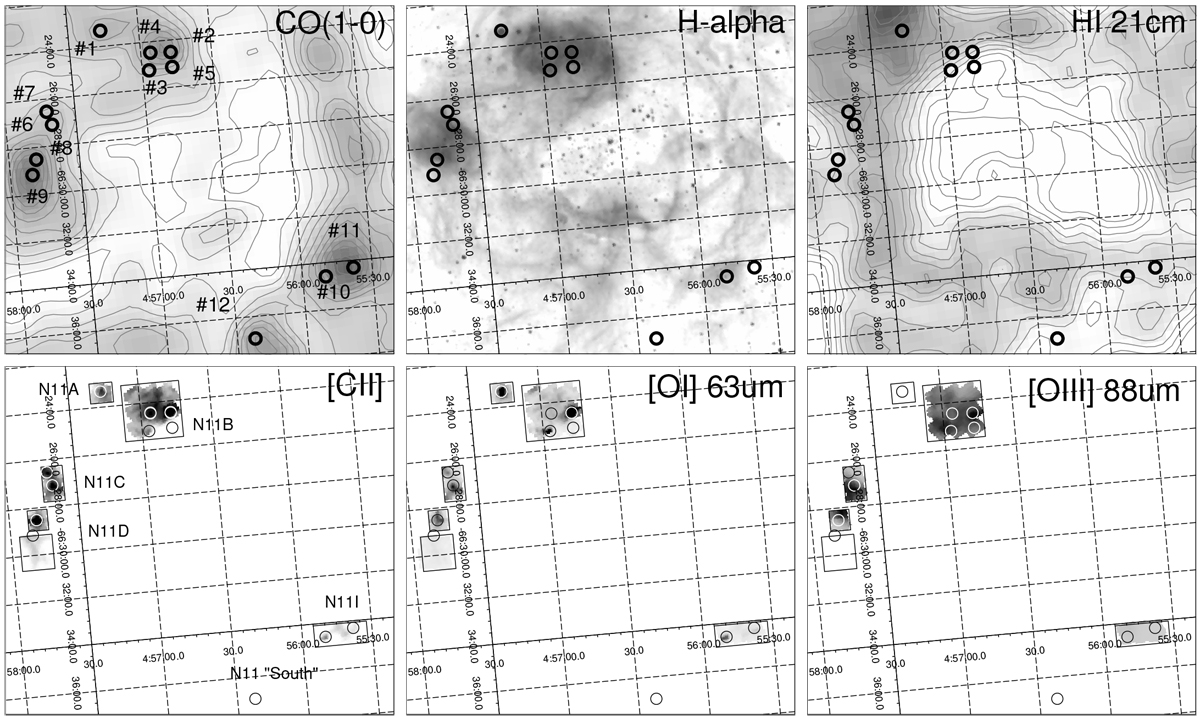
LMC-N 11 in CO, Hα, H I, [C II], [O I], and [O III]. The SOFIA/GREAT pointings are shown as black/white circles and labelled in the CO panel. The black rectangles show the Herschel/PACS coverage. Region names are labelled in the [C II] panel. GREAT pointings #1 (N 11A) and #9 (part of N 11D) were not observed in [O III], and pointing #12 (N 11 “South”) was not observed with PACS.
Current usage metrics show cumulative count of Article Views (full-text article views including HTML views, PDF and ePub downloads, according to the available data) and Abstracts Views on Vision4Press platform.
Data correspond to usage on the plateform after 2015. The current usage metrics is available 48-96 hours after online publication and is updated daily on week days.
Initial download of the metrics may take a while.