Open Access
Fig. 13
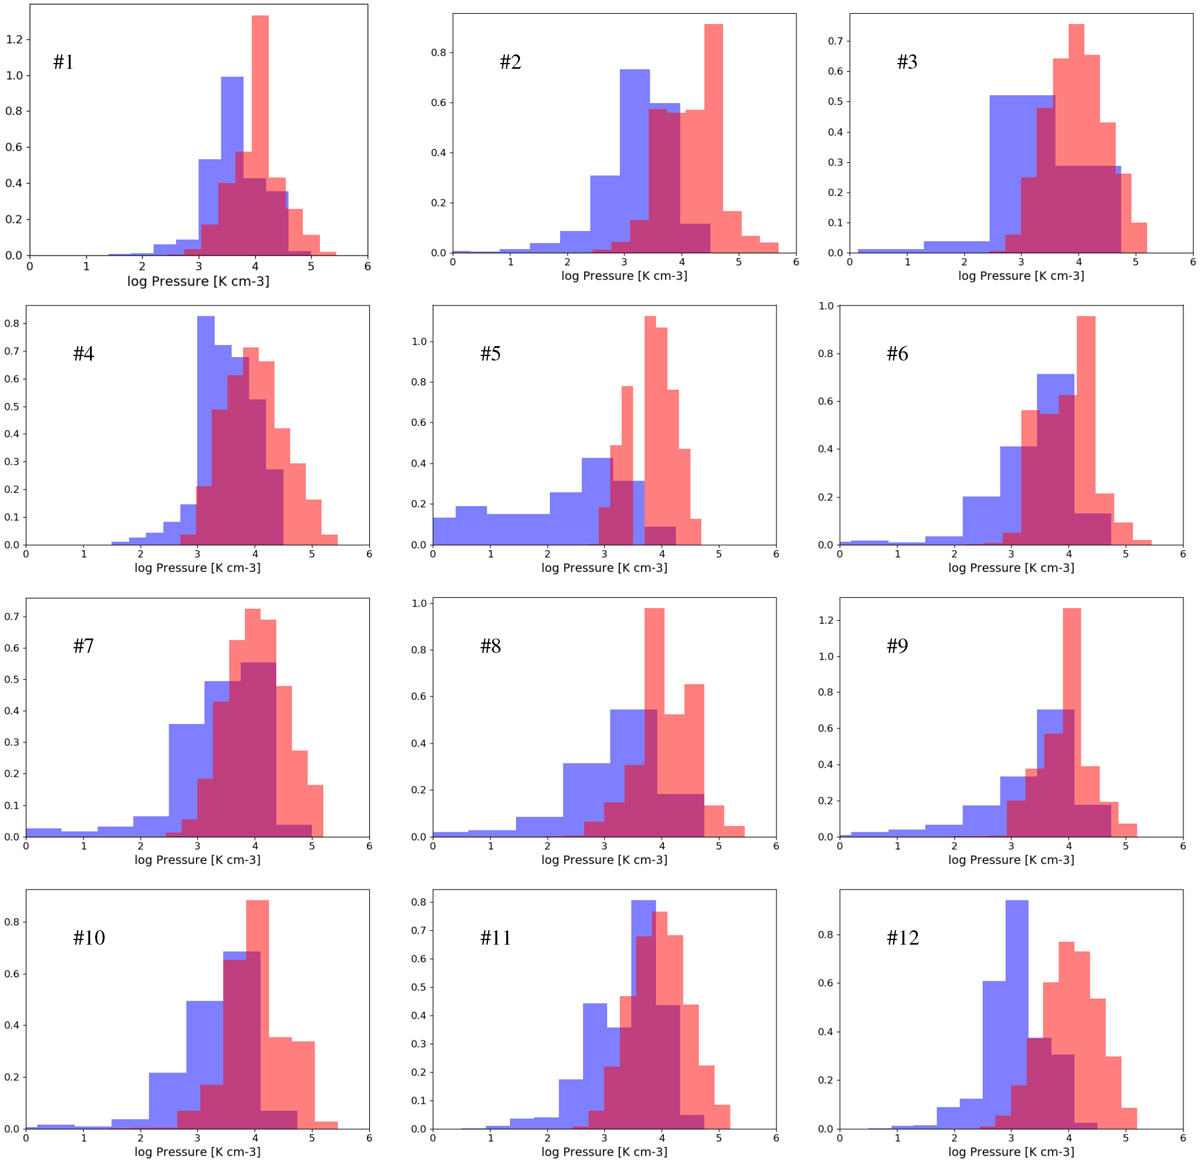
Histogram of the modeled pressure in the neutral atomic (blue) and CO-dark H2 gas (red) forall the velocity components. Results from all decomposition methods are combined (see Table 6).
Current usage metrics show cumulative count of Article Views (full-text article views including HTML views, PDF and ePub downloads, according to the available data) and Abstracts Views on Vision4Press platform.
Data correspond to usage on the plateform after 2015. The current usage metrics is available 48-96 hours after online publication and is updated daily on week days.
Initial download of the metrics may take a while.