Open Access
Fig. 14
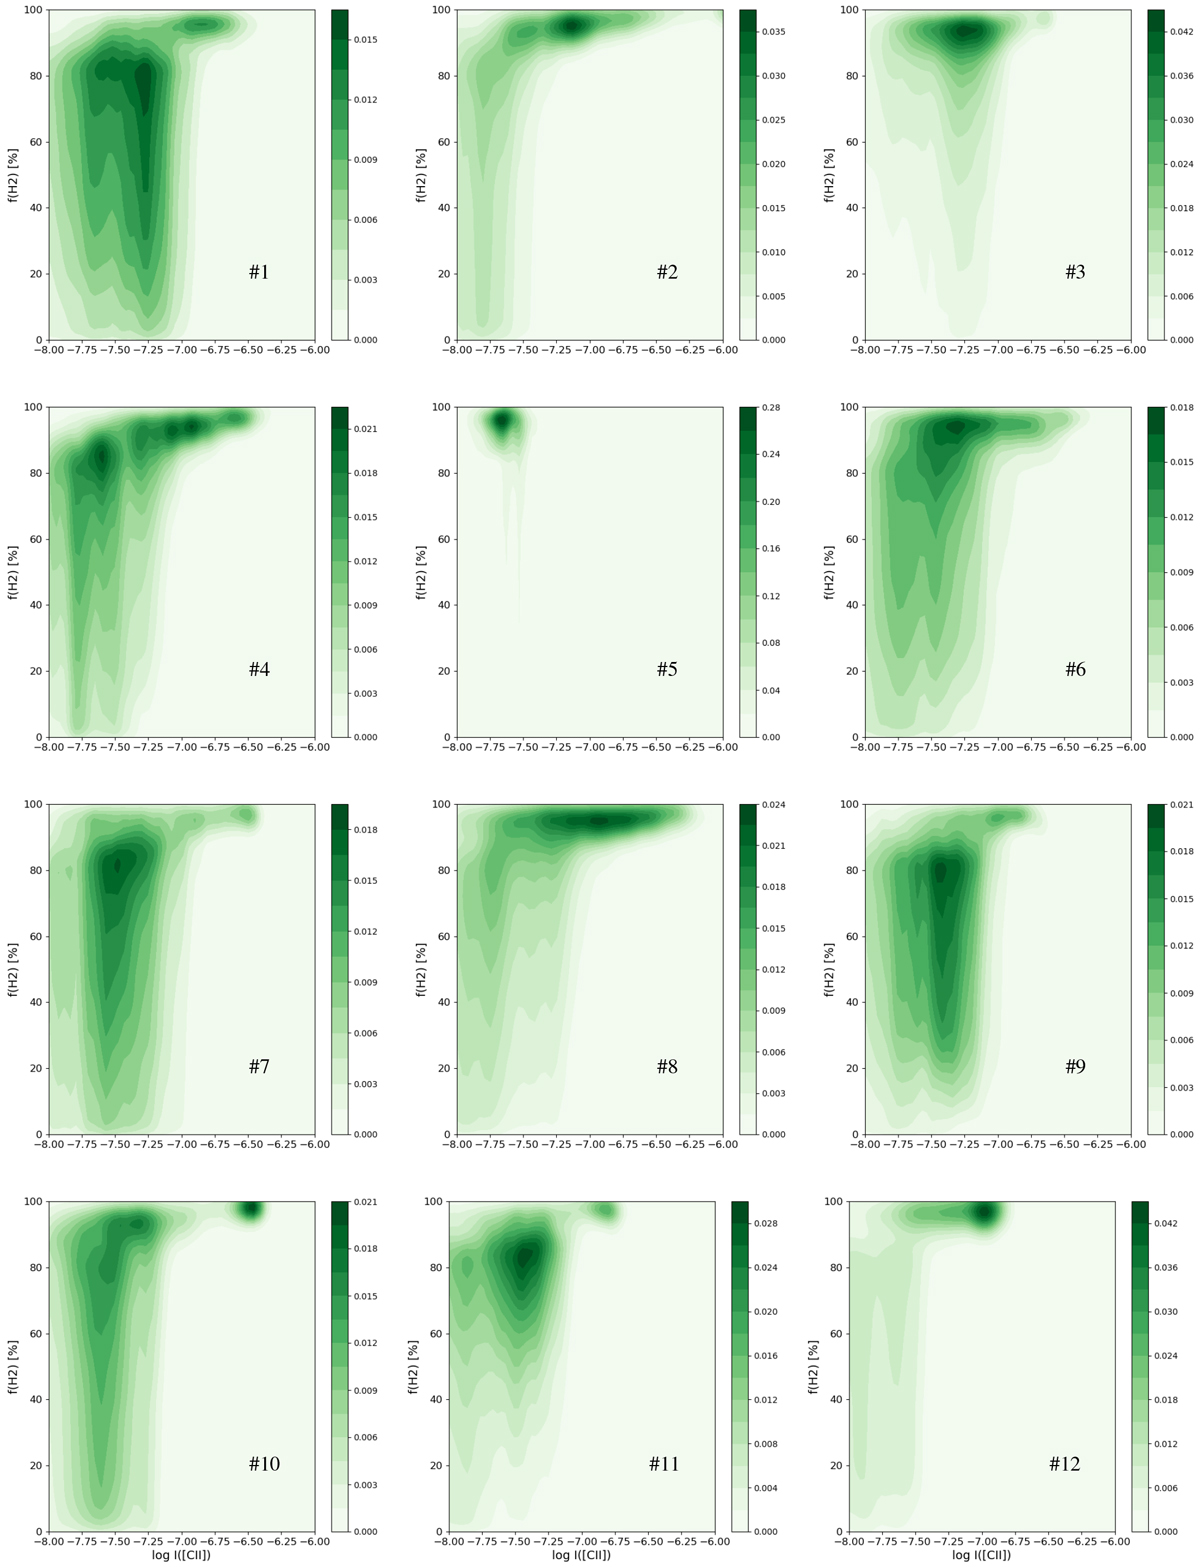
Same as Fig. 9 but with the total molecular gas fraction (i.e., including the CO-dark H2 gas). The vertical striping is due to the wide ranges for the molecular gas fraction determination for the faintest [C II] components. The shade scales with the density of points.
Current usage metrics show cumulative count of Article Views (full-text article views including HTML views, PDF and ePub downloads, according to the available data) and Abstracts Views on Vision4Press platform.
Data correspond to usage on the plateform after 2015. The current usage metrics is available 48-96 hours after online publication and is updated daily on week days.
Initial download of the metrics may take a while.