Fig. 17
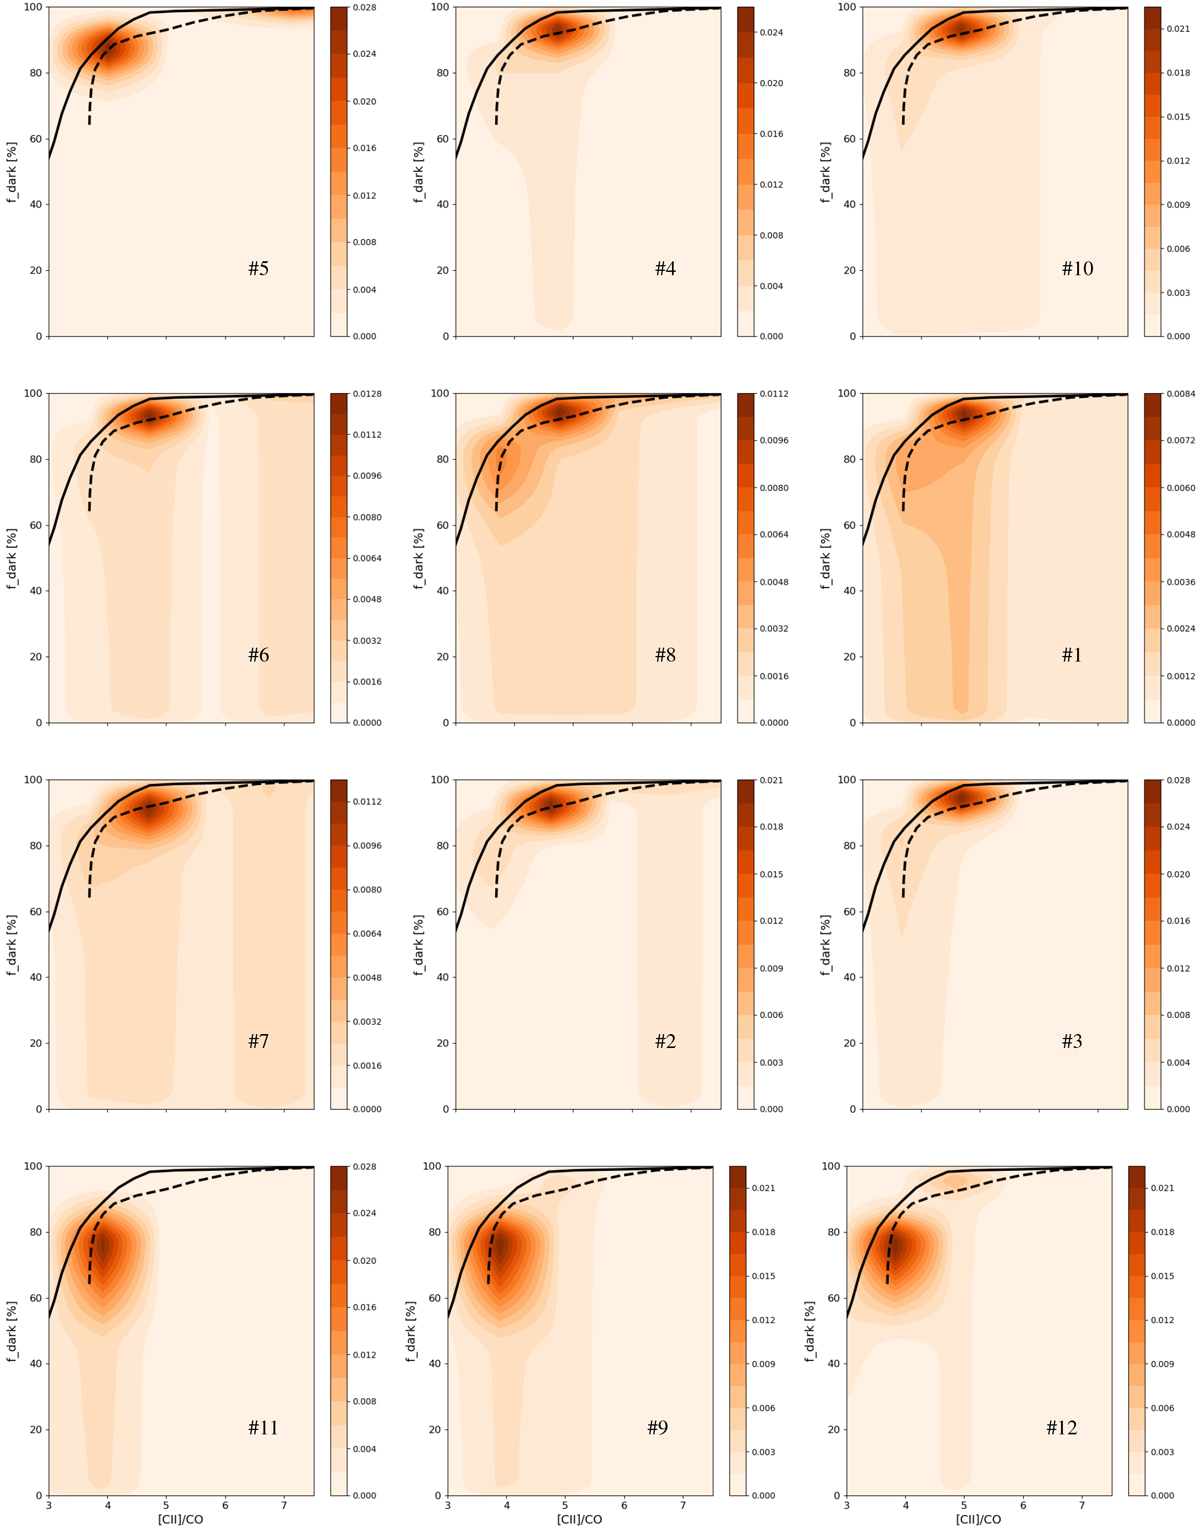
Bivariate kernel density estimate of the fraction of CO-dark H2 gas fdark vs. the [C II]/CO ratio for all pointings. The shade scales with the density of points. The dashed curve is an attempt toconnect most of the distribution peaks from different pointings (with the plots ordered according the location of probability peaks along the curve) while the solid curve shows the expected relation between fdark and [C II]/CO at low density (~30 cm−3; Fig. 11).
Current usage metrics show cumulative count of Article Views (full-text article views including HTML views, PDF and ePub downloads, according to the available data) and Abstracts Views on Vision4Press platform.
Data correspond to usage on the plateform after 2015. The current usage metrics is available 48-96 hours after online publication and is updated daily on week days.
Initial download of the metrics may take a while.